Reading A Four-Batter Outlier: A Model Breakdown For The Board
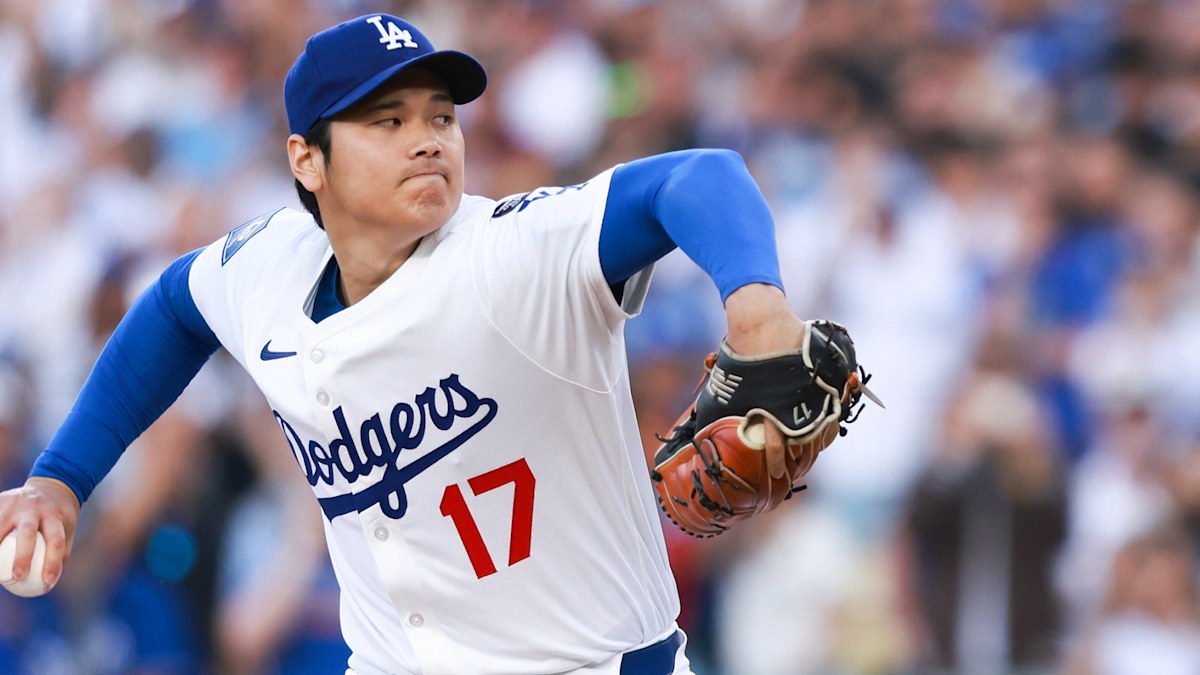
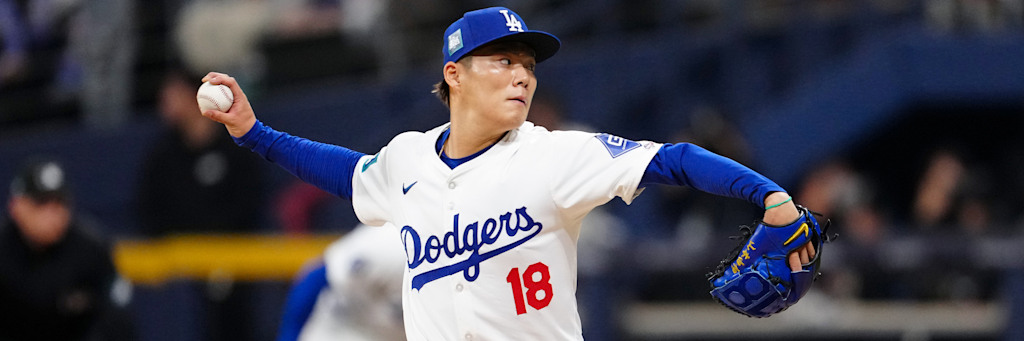
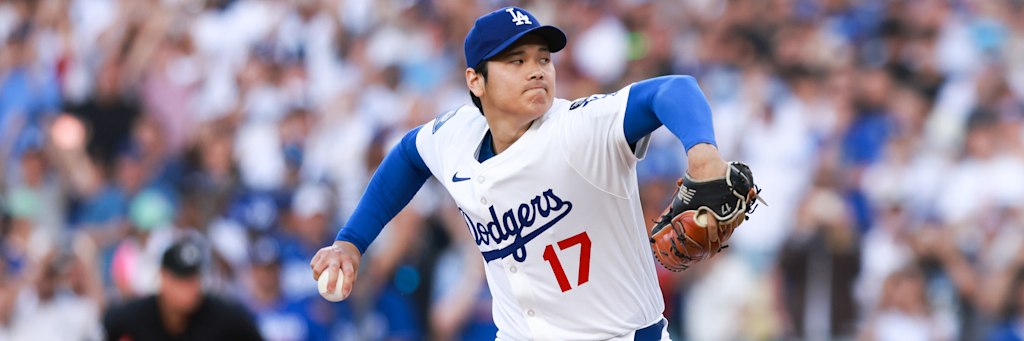
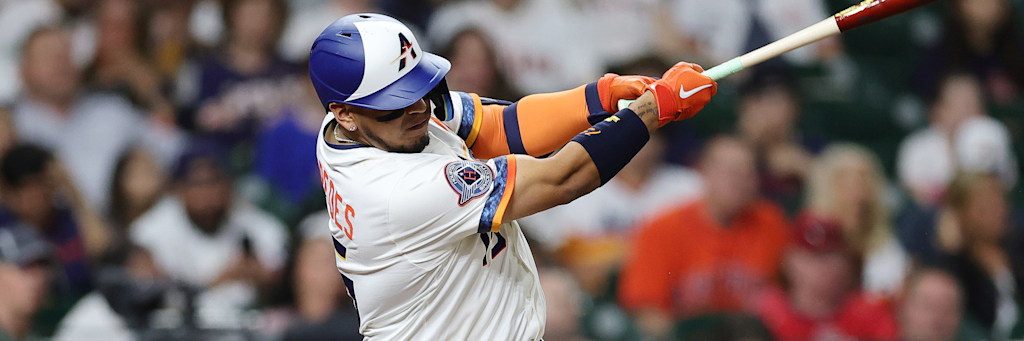
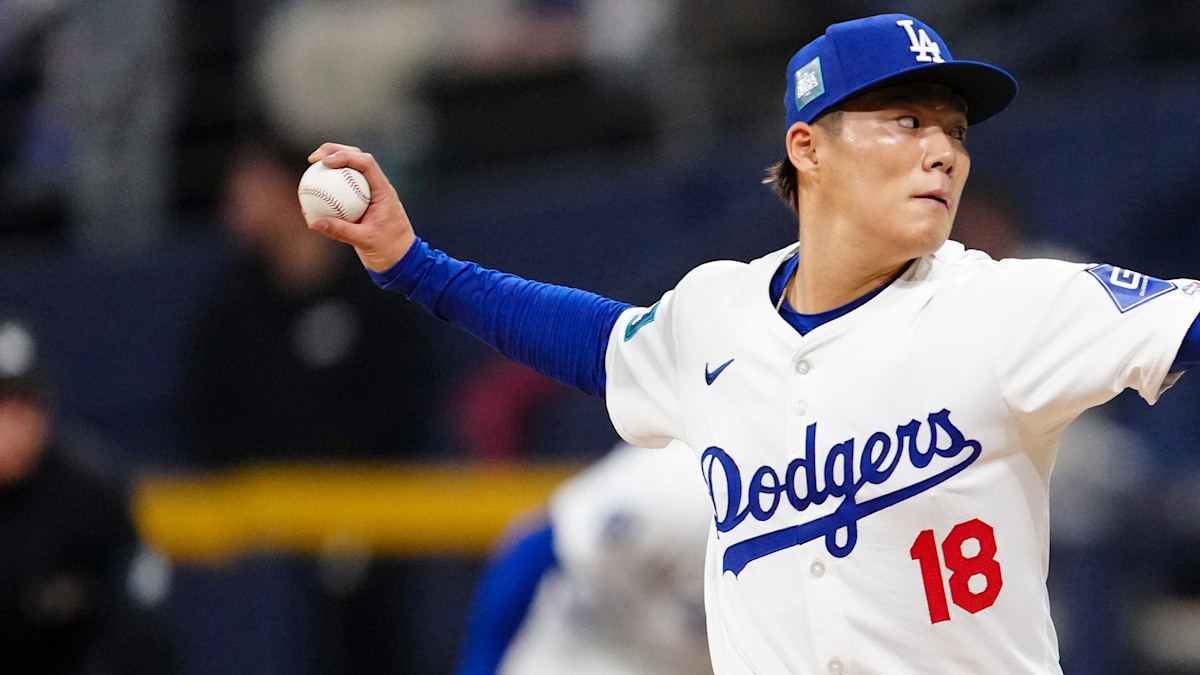
A sample-size read on five games: Valdez's zero-out July 21 disaster barely moves a 113-inning baseline, Yamamoto's 0.90 WHIP anchors the largest true edge, and one game offers the board's only real plus-money value.
📊 0.90 WHIP Anchors LAD⚾ 5 Games, 1 Value Read
View Full Article →