The Whole Number Model: What A Minus 1 Run Line Is Actually Worth
Tonight the biggest single ticket on the public card is a whole number run line: Texas at minus 1. It is not a market DraftKings or FanDuel print. They go straight from the moneyline to minus 1.5, so anyone taking minus 1 is taking a price from somewhere else with no easy way to check it against a screen.
That is exactly the situation a small model is for. The Whole Number Model does one thing: it takes a moneyline, removes the vig, and converts it into a fair price for the same team at minus 1 and at minus 1.5. It uses a single empirical input, and the whole point of publishing it is that the input can be checked against five months of finals.
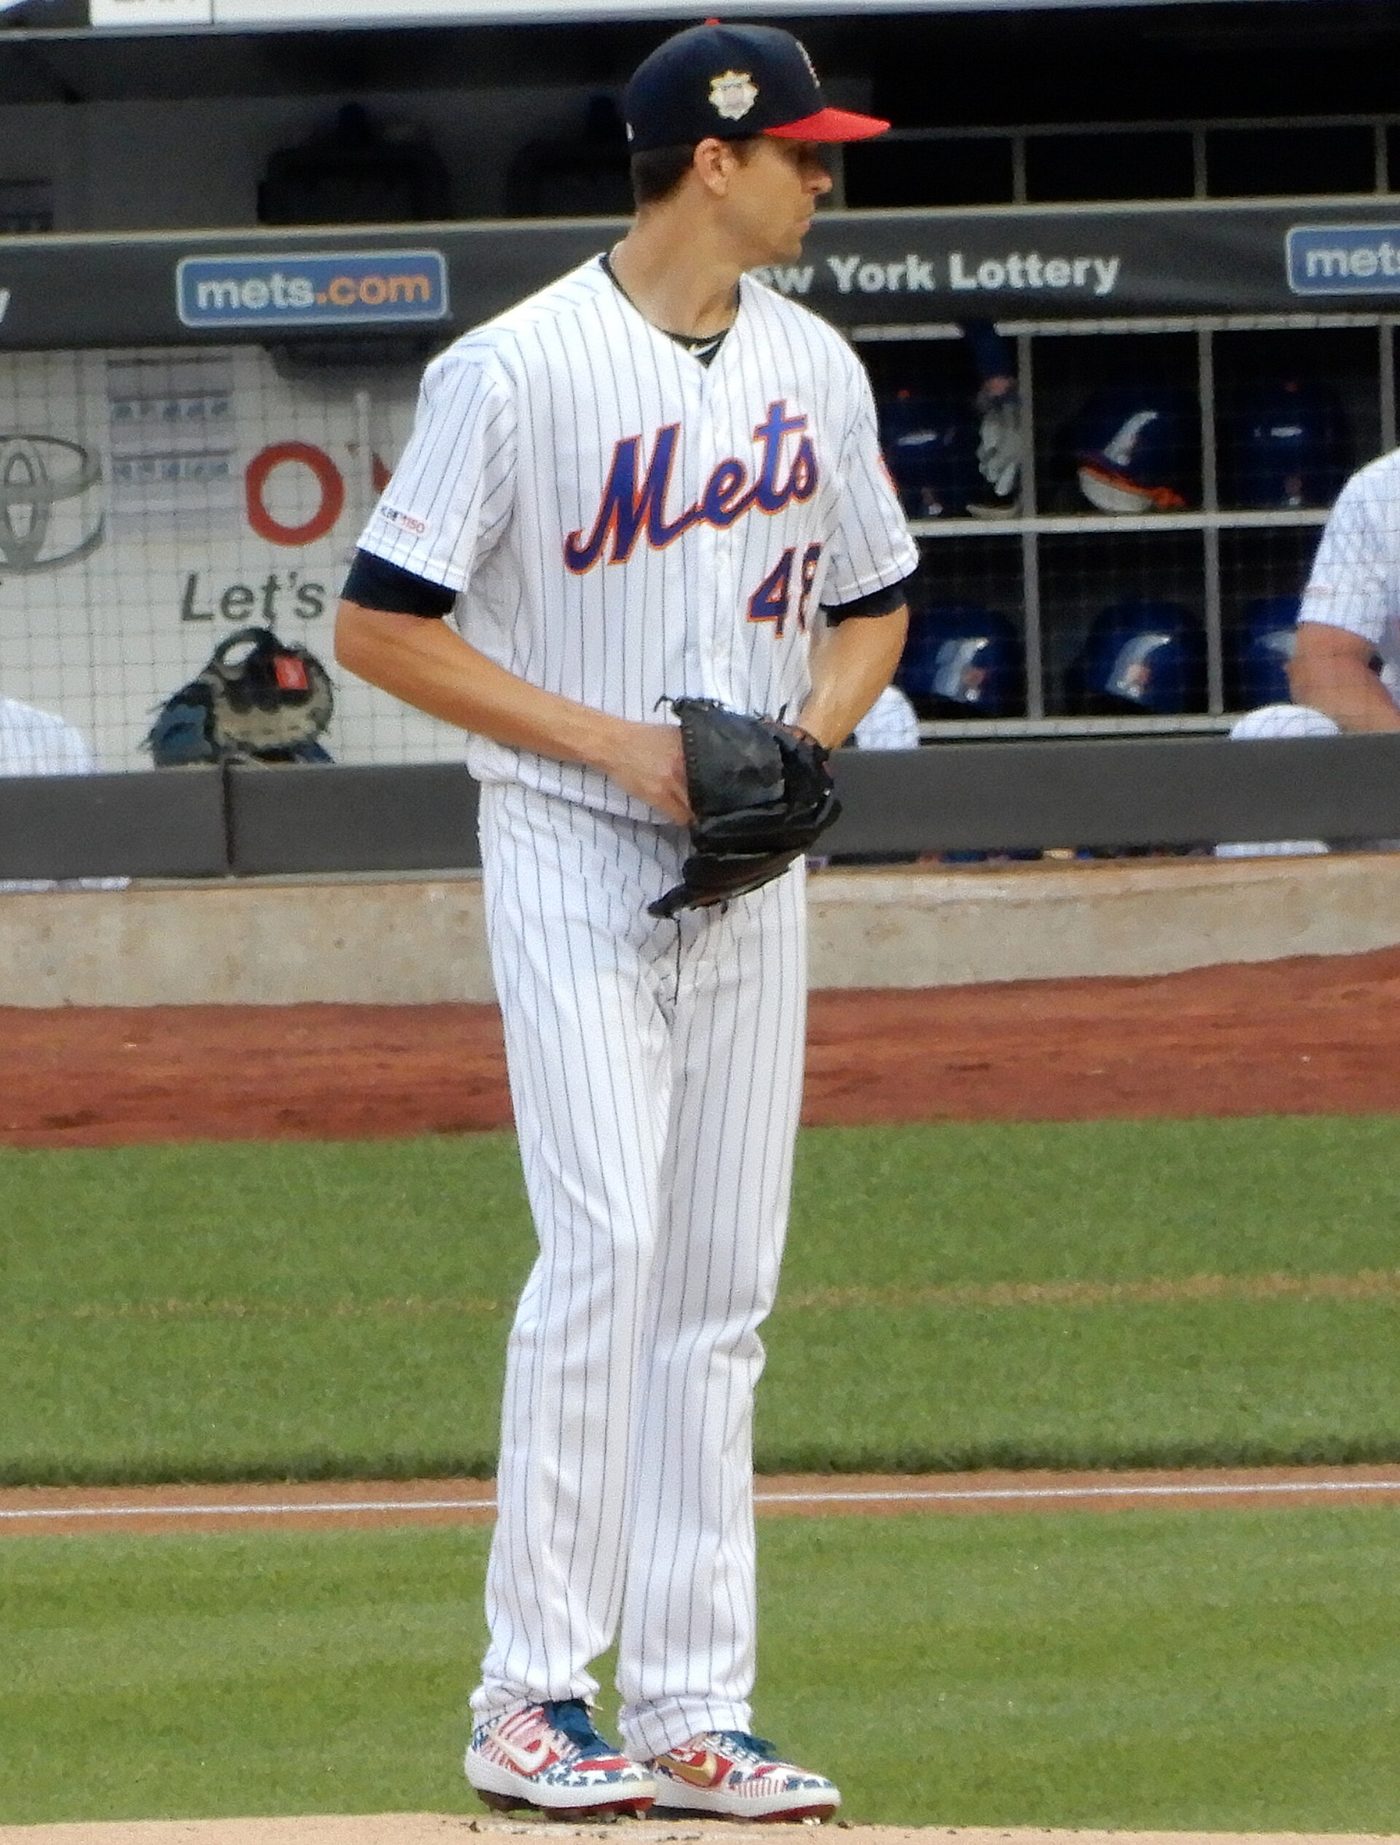
Jacob deGrom. The model prices the run line under his start without knowing he is pitching, which is both its discipline and its limitation. Photo by slgckgc, CC BY 2.0 via Wikimedia Commons.
The One Input
Everything turns on a single conditional probability: given that a team wins, how often does it win by exactly one run. If that number is stable, then a moneyline contains all the information needed to price a run line, because the run line is just the moneyline with the one run wins carved out.
Backtest: 1,452 games from the 2026 regular season in which both clubs had already completed 40 games. For each, the club with the better pregame winning percentage was labelled the stronger side, using only games that had already finished.
| Measure | Result | Rate |
|---|---|---|
| Stronger club wins | 785 of 1,452 | 54.06% |
| Given it won, margin was exactly 1 | 212 of 785 | 27.01% |
| Given it won, margin was 2 or more | 573 of 785 | 72.99% |
Now the stability test, because a model built on a constant is worthless if the constant moves. Split those 785 wins by how large the pregame gap between the two clubs was.
| Pregame win percentage gap | Wins | Margin of exactly 1 |
|---|---|---|
| .000 to .049 | 281 | 24.56% |
| .050 to .099 | 245 | 28.57% |
| .100 to .149 | 144 | 28.47% |
| .150 to .199 | 69 | 31.88% |
| .200 and up | 46 | 21.74% |
No trend. The two extreme buckets hold 46 and 281 games and point in opposite directions, and the middle three sit within four points of each other. Bigger favourites do not convert their wins into blowouts at a higher rate, which is the assumption the model needs and the assumption most people carry around without testing.
The Three Lines Of Arithmetic
Take a moneyline pair. Convert both sides to implied probability, divide each by the sum to remove the vig, and call the favourite's share p. Then:
P(covers minus 1.5) = p times 0.7299
P(pushes on minus 1) = p times 0.2701
P(loses either) = 1 minus p
For a whole number the push is removed from the denominator, so the rate a price has to beat is the covers figure divided by covers plus loses. That is the entire model. No park factor, no starter, no bullpen, no weather.
Tonight In Arlington
Athletics at Rangers. The market pair is Texas minus 200, the Athletics plus 185. Those imply 66.67 and 35.09 percent, a 101.76 percent book. Divide out and Texas is 65.52 percent to win.
| Outcome | Model probability |
|---|---|
| Texas by 2 or more | 47.82% |
| Texas by exactly 1 | 17.70% |
| Athletics win | 34.48% |
That gives two model prices.
Texas minus 1.5 fair at plus 109. The market has it at plus 106. The model is three cents away from a line thousands of people are trading, which is the only validation available and it is a good one.
Texas minus 1 fair at minus 139. Decided games only, 47.82 divided by 47.82 plus 34.48, which is 58.10 percent, and 58.10 percent is minus 138.7 in American terms.
What That Says About The Price Being Paid
The minus 1 available tonight is minus 165. That implies 62.26 percent. The model says 58.10 percent. The gap is 4.16 points of win probability, or about 26 cents of price.
Put another way: the model agrees with the market almost exactly on minus 1.5 and then disagrees with it by a quarter of a dollar on minus 1. The push insurance is real and it is worth paying for, but by this model it is worth about minus 139, not minus 165. Whoever is quoting the whole number is charging a premium for a market nobody can easily shop.
What The Model Does Not Know, And Why That Matters Tonight
This is a one input model and its blind spot is enormous. It never learns who is pitching. Tonight that blind spot is pointed directly at the most lopsided starting pitcher matchup on the board.
Jacob deGrom has 159 strikeouts against 37 walks in 130.1 innings with a 1.18 WHIP and a .234 opponent average. The Athletics have allowed 787 runs in 137 games, a 5.43 team ERA and a 1.50 team WHIP, all of them the worst figures among the eight clubs playing in the four games this card touches. Gage Jump carries a 4.69 ERA and 42 walks in 88.1 innings.
If those facts move Texas from 65.52 percent to something like 70, the model output moves with it and minus 165 stops looking rich. The moneyline is where that argument has to be won, because the model takes the moneyline as truth and only converts it. What the model can say is narrower and still useful: relative to the moneyline the market is already offering, the whole number is priced about 26 cents above fair.
The Same Arithmetic On The Rest Of The Board
Run the conversion on the other three games this card touches and you get the fair whole number price for each home favourite, from the market moneyline alone.
| Game | Devigged favourite | Model fair at minus 1 |
|---|---|---|
| Athletics at Rangers | Texas 65.52% | minus 139 |
| Mets at Rays | Tampa Bay 61.75% | minus 118 |
| Mariners at Red Sox | Boston 60.82% | minus 113 |
| White Sox at Astros | Houston 55.06% | plus 112 |
The Houston row is the one worth staring at. A club that is a moneyline favourite at minus 127 is an underdog at minus 1, at plus 112, because taking away the one run win takes away 27 percent of its winning outcomes. That is the whole idea in one line: a favourite and a whole number favourite are very different animals, and the gap between them is 27 percent of the wins.
Data note: Results come from the MLB Stats API for the 2026 regular season, all games with a Final status from March 25 through August 30, 2026, which is 2,058 games. The backtest is restricted to games in which both clubs had completed 40 or more, which leaves 1,452. Pregame winning percentages were computed only from games finishing strictly before the game being rated, so nothing peeks forward. Across all 2,058 games a one run margin occurred 559 times, 27.16 percent, which is within a fifth of a point of the 27.01 percent measured on the stronger club subset. Moneylines quoted are the DraftKings prices on the public board at 12:45 Eastern on August 31, 2026. No result of this model is a recommendation to bet anything.