The Suppression Model: Log5 On Four Team Total Unders
Four of tonight's team totals are priced under 3.5. Every one of them is sold on the same sentence: this starter has held opponents to three or fewer in most of his starts. That sentence is true for all four pitchers and it is the wrong input, because a team total settles on nine innings and a starter's line covers five or six of them.
The Suppression Model fixes that with two inputs and one piece of arithmetic that has been in baseball for fifty years. It asks how often the opposing club gets held to three or fewer by anybody, asks how often the full opposing team got held to three or fewer in this specific pitcher's starts, and combines them against the league baseline using log5. No park term, no weather, no lineup card. Two rates and a baseline.
The Two Inputs
Input A, the lineup rate. How often this club has been held to three runs or fewer across its own 2026 season. Every completed regular season game, no filtering by opponent or park. It is a description of the offense and nothing else.
Input B, the suppression rate. For the starting pitcher, how often the club he faced finished the whole game with three runs or fewer. Not what he allowed. What the opponent finished with. That number carries the bullpen, the defense, the manager's hook and every inning he did not throw.
The baseline, C. The league rate. Across 4,000 team games in 2026, a club is held to three or fewer 45.07 percent of the time. That is the number a coin would produce with no information about either side.
Combine them with log5, the standard odds ratio chain. The projected probability is A times B divided by C, over that same quantity plus (1 minus A) times (1 minus B) divided by (1 minus C). If either input equals the league baseline, the model returns the other one unchanged, which is the property that makes it the right tool here.
The Gap Between What A Pitcher Allowed And What The Team Finished With
Before the outputs, look at input B on its own, because it is where three quarters of tonight's disagreement lives.
| Starter | Held opponents to 3 or fewer himself | Opponent finished with 3 or fewer | Gap |
|---|---|---|---|
| Cam Schlittler | 23 of 27 (85.2%) | 18 of 26 (69.2%) | 16.0 points |
| Dylan Cease | 19 of 24 (79.2%) | 14 of 22 (63.6%) | 15.5 points |
| Shane McClanahan | 16 of 22 (72.7%) | 9 of 22 (40.9%) | 31.8 points |
| Tanner Bibee | 20 of 27 (74.1%) | 10 of 27 (37.0%) | 37.0 points |
Read the two middle columns as separate seasons, because they nearly are. On the starter column these four pitchers sit within thirteen points of each other, from 72.7 to 85.2. On the column that a team total actually settles on, they spread across thirty two points, from 37.0 to 69.2. The ranking flips: Bibee is third of four on his own line and dead last on the line that pays.
Bibee averages 5.79 innings a start and McClanahan averages 4.88, the two shortest outings in the group. Schlittler averages 5.85 and Cease 6.01. That is not a large enough spread in innings to explain a thirty two point gap on its own, which means bullpen quality and game state are doing real work here too. The model does not try to separate those. It just uses the number that already contains all of them.
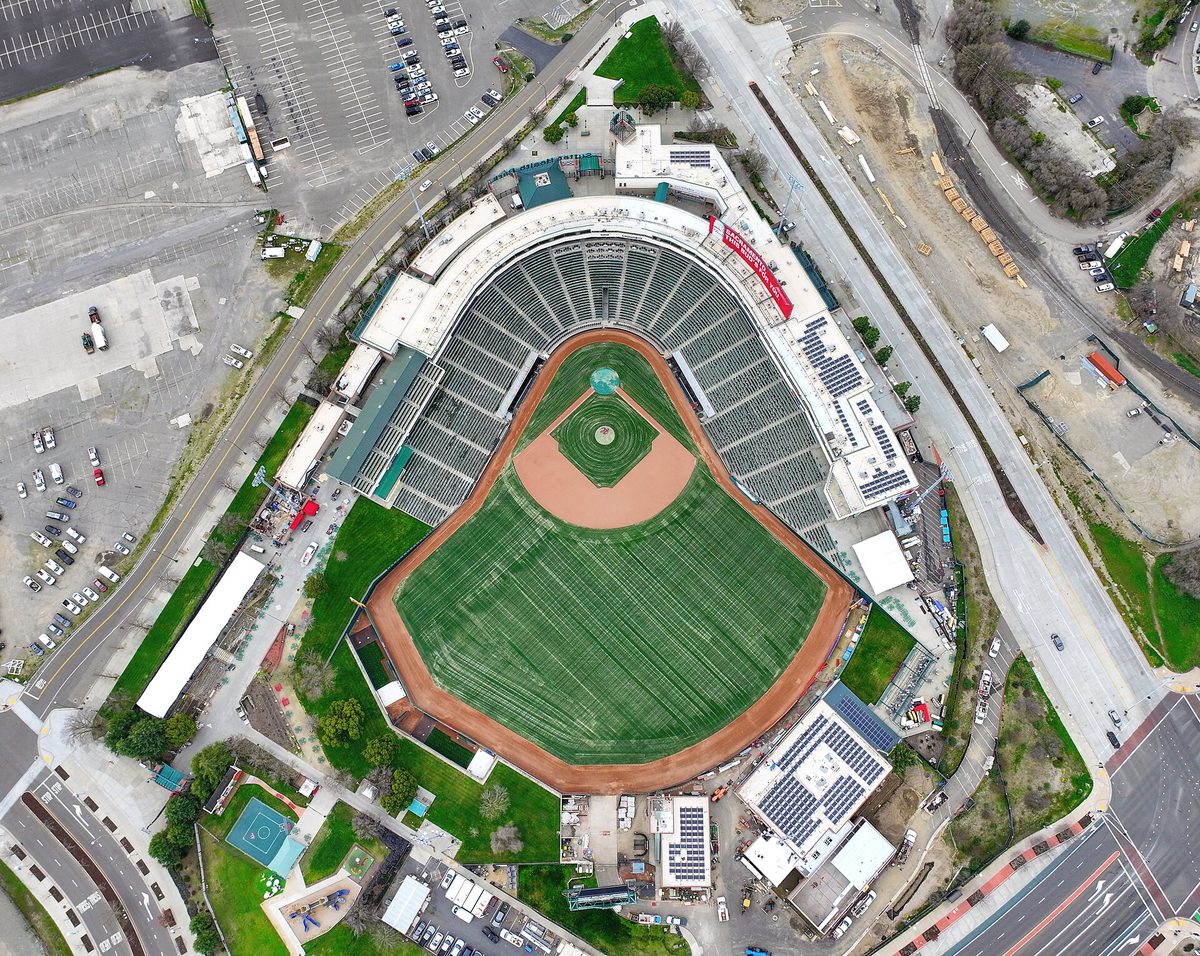
Sutter Health Park has hosted 66 home dates averaging 12.02 combined runs. No team total under is priced here tonight, and the model would not support one if it were. Photo: Quintin Soloviev, Wikimedia Commons, CC BY 4.0
The Four Outputs
| Ticket | A, lineup rate | B, suppression rate | Model | Price | Break even | Edge |
|---|---|---|---|---|---|---|
| Red Sox under 3.5, Schlittler | 42.9% | 69.2% | 67.3% | -135 | 57.4% | plus 9.8 |
| Mariners under 3.5, Cease | 51.5% | 63.6% | 69.3% | -155 | 60.8% | plus 8.6 |
| Padres under 3.5, McClanahan | 47.8% | 40.9% | 43.6% | -118 | 54.1% | minus 10.6 |
| Royals under 3.5, Bibee | 48.9% | 37.0% | 40.7% | -120 | 54.5% | minus 13.9 |
Two of the four clear the price by roughly nine points and two miss it by roughly twelve, and nothing in column A explains the split. The four lineup rates sit inside a seven point band, from Boston at 42.9 to Seattle at 51.5. Column B does all the separating.
The Seattle output is the one worth pausing on. Its lineup rate is the highest of the four at 51.5 percent, which is the model telling you Seattle is genuinely the quietest offense of the group, and its suppression input is the second best at 63.6. Those stack to 69.3 against a price needing 60.8, the largest gross number on the board even though it is not the largest edge.
Boston is the opposite construction. The Red Sox have the loudest lineup of the four at 42.9 percent held to three or fewer, and they still produce the second highest projection because Schlittler's suppression input is the best number anywhere in this table. Log5 handles that trade honestly instead of averaging it away.
Where The Model Is Probably Wrong
Two things pull against the two negative rows, and both are real.
Sample and opponent quality. Input B is measured against whichever lineups the pitcher happened to draw. Bibee's 37.0 percent came against his 2026 schedule, not against Kansas City. If he has faced a harder run of offenses than tonight's, his suppression rate understates him and the Royals output is too low. The model has no way to see that and does not pretend to.
Recency. Input A is a full season rate. Kansas City is 9-1 in its last ten and has scored 5.40 runs a game across its last fifteen, which is a far louder offense than its 48.9 percent season figure suggests. That cuts the same direction as the model on this ticket, so here recency makes the negative edge worse rather than better. On Boston it cuts the other way: the Red Sox are at 5.07 runs a game over fifteen games, which argues their 42.9 percent is stale in the direction that hurts the under.
A conditional rate stacked on an unconditional one. Log5 assumes A and B are independent measurements of the same event. They are not perfectly independent, because the pitcher's suppression rate was itself produced against some distribution of offenses. The bias is small at these sample sizes and it is not zero.
What The Model Does Not Do
It does not pick anything. It prices four tickets that were selected elsewhere and reports where its own arithmetic lands relative to the posted number. Two of the four disagree with the price by more than ten points in the wrong direction, and that disagreement is published here rather than buried, because a model that only gets quoted when it agrees is not a model.
Rebuilding It Yourself
Three queries. Pull the 2026 schedule with linescore hydration for a club and count how often it finished with three or fewer to get A. Pull a starter's game log, filter to starts, resolve each gamePk back through the schedule endpoint and take the runs for the club he faced to get B. Count every team game in the league the same way to get C. Then apply log5 in one line.
Every figure in the tables above came out of those three queries and nothing else. If you disagree with an output, you can point at the exact row of the exact query responsible for it, which is the only property of a model worth defending.