The Shared Night Model: Whether MLB Totals On The Same Date Move Together
Anybody who has held four unders on a Tuesday has felt this. The first two land, the third lands, and by the fourth it stops feeling like four bets and starts feeling like one. Runs are hard to come by tonight, the reasoning goes. The ball is not carrying. The zone is wide. Whatever is true tonight is true everywhere.
The Shared Night Model asks whether that is a real property of baseball or a story people tell after the fact. There is one question: do combined run totals on the same calendar date move together?
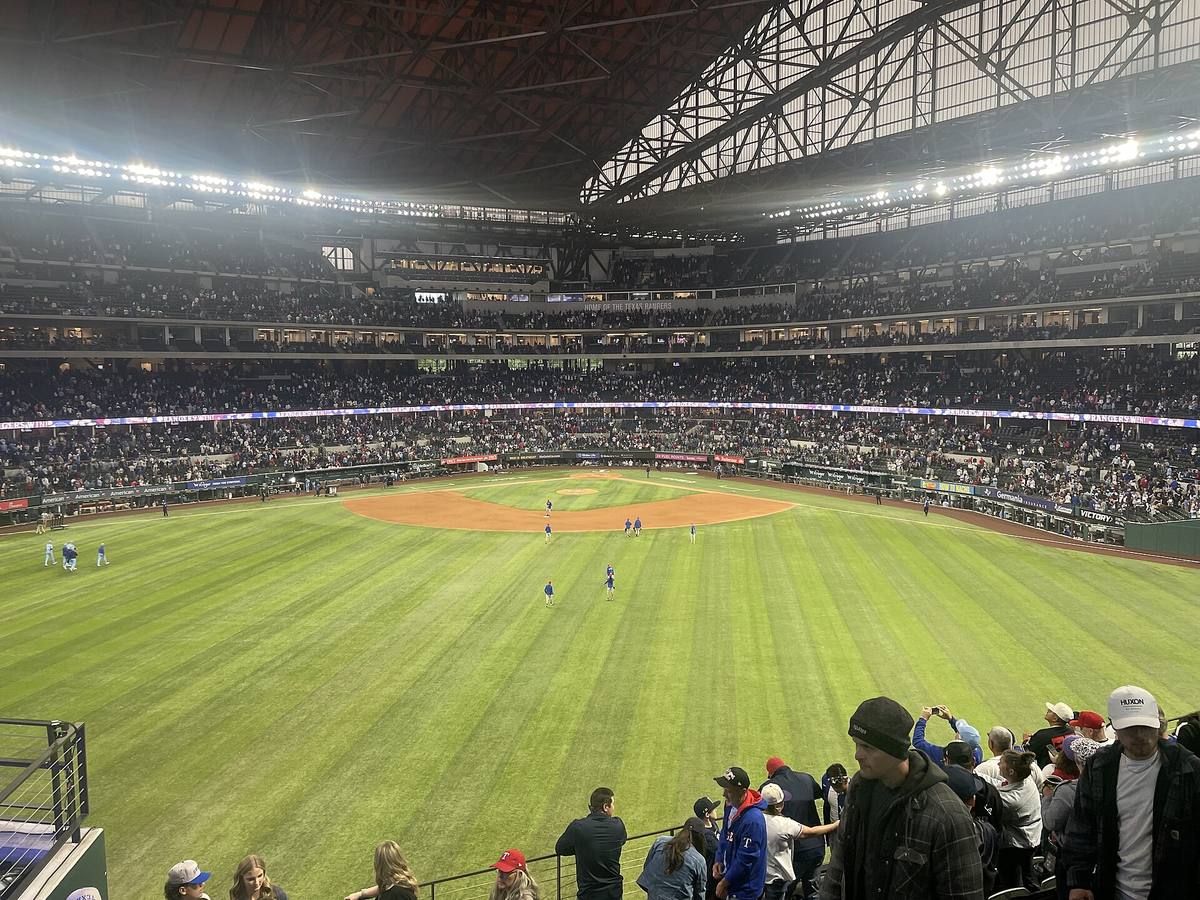
Globe Life Field, Arlington. Fifteen games are played on a normal night and every one of them has its own park, crew and pair of starters. Whether they share anything beyond a date is a measurable question. Photo: BullDawg2021, CC BY 4.0, via Wikimedia Commons.
The Baseline
Every 2026 regular season game with a Final status and at least five innings on the linescore, from March 1 through September 4. 2,122 games across 161 dates, deduplicated by gamePk. For each game, the combined final runs.
| Measure | Value |
|---|---|
| Mean combined runs per game | 8.959 |
| Standard deviation, game level | 4.537 |
| Dates with a slate of 8 or more | 151 |
| Median slate size on those dates | 15 |
The analysis below uses those 151 full slate dates. Short dates are excluded because a two game Thursday produces a daily average with enormous sampling error and would do nothing but add noise to a question about shared conditions.
The Test
If games on the same date shared nothing, the average of a 15 game slate would still bounce around from night to night. That is sampling noise and it is entirely predictable in size: the game level standard deviation divided by the square root of the slate size.
If games on the same date did share something, that bounce would be larger than sampling noise alone can explain. The whole model is that one comparison.
| Quantity | Value |
|---|---|
| Observed standard deviation of daily mean runs | 1.271 |
| Expected if games were independent | 1.240 |
| Ratio | 1.025 |
Two and a half percent. That is the entire size of the shared night effect in 2026 to date.
The Finding: It Is Not There
Turning that ratio into a variance component gives the between date share of total variance, which is the intraclass correlation.
| Component | Value |
|---|---|
| Total variance, game level | 20.58 |
| Between date variance | 0.116 |
| Intraclass correlation | 0.0056 |
Half of one percent. And that estimate is not distinguishable from zero. A permutation test that shuffles all 2,122 games at random across the same 151 slate shapes, repeated 2,000 times, produces a between date variance of daily means averaging 1.538 against an observed 1.615. The p value is 0.31. Roughly one random reshuffle in three produces a season that looks at least as clustered as the real one.
The Same Test, Priced As A Bettor Would See It
Variance components are the honest way to state the result and the least useful way to feel it. The same question in ticket terms: what fraction of games on a given date finish under 8.5, and does that fraction swing more than chance allows?
| Quantity | Value |
|---|---|
| Mean share of games under 8.5 | 50.85% |
| Observed standard deviation of that daily share | 0.1356 |
| Expected if independent | 0.1366 |
| Ratio | 0.993 |
Below one. The daily under share this season has bounced around slightly less than independent games would, which is what a true effect of zero looks like once sampling error is added to it.
Of the 151 full slates, 11 saw 70 percent or more of their games finish under 8.5 and 11 saw 30 percent or fewer. Symmetric, and close to what independence predicts. There is no fat tail of league wide low scoring nights.
The Direct Simulation
The cleanest version of the question. Draw five games at random from a single date, 200 draws per slate, 30,200 draws in total. How often do all five finish under 8.5?
| Outcome | Same date draws | Independent |
|---|---|---|
| All five under 8.5 | 3.44% | 3.40% |
| All five over 8.5 | 2.76% | 2.87% |
Four hundredths of a percentage point on one side and eleven on the other, in opposite directions. A bettor holding five unders on one slate is holding five bets, not one. The intuition that says otherwise is measuring memory, not baseball.
Where The Real Clustering Is
The result is not that nothing moves together. It is that the calendar date is the wrong unit. Sort the same 2,122 games by month and the movement is obvious and much larger than anything found within a night.
| Month | Games | Mean combined runs |
|---|---|---|
| March | 76 | 8.618 |
| April | 391 | 9.090 |
| May | 419 | 8.609 |
| June | 394 | 9.348 |
| July | 371 | 9.008 |
| August | 416 | 8.704 |
| September, through the 4th | 55 | 9.964 |
A 0.74 run spread between May and June, and a September figure a full run above the season mean on a small sample. Season long conditions drift. Individual nights do not cohere. Those are different claims and only one of them holds.
The Nights That Looked Shared
They exist and they are why the belief survives. On June 22 twelve games averaged 5.33 combined runs. On April 13 ten games averaged 14.40. Those two dates are 9.07 runs apart and both are real.
The point of the permutation test is that dates like those appear in randomly reshuffled seasons at almost the same rate they appear in the real one. With 151 slates of about 15 games, extremes are guaranteed. Remembering the night everything went under is not evidence that nights go under together. It is evidence that 151 draws from a wide distribution produce some low draws.
What The Model Does Not Do
It does not test correlation inside a single game. A side and a total on the same game are genuinely correlated and nothing here speaks to that. The claim tested is across different games on one date.
It does not test weather at the park level. A hot humid night in one city almost certainly raises run scoring in that city. The model tests whether such conditions align across cities on the same date, and finds they do not, which is a much weaker and more testable claim than saying weather is irrelevant.
It does not adjust for schedule structure. Slates are not random draws of teams. A date with several games between weak offenses will run low for reasons that are not a shared night, and this model would count that as clustering. That bias runs toward finding an effect, and the measured effect is still 0.0056.
It uses one threshold. The under share test is against a fixed 8.5 rather than each game's posted total. A version run against posted lines would be a better test of what bettors actually hold, and it is the obvious next build.
The finding that survives all four is the ratio in the second table. Games that share a date share a date. On the evidence of 2,122 of them, they share almost nothing else.
Data note: Results come from the MLB Stats API for the 2026 regular season, every game with a Final status and at least five innings on the linescore from March 1 through September 4, 2026, deduplicated by gamePk to 2,122 games across 161 dates. Combined runs are the published final home plus away score, extra innings included at face value. Daily analysis is restricted to the 151 dates carrying 8 or more such games. The expected standard deviation of daily means is the game level standard deviation divided by the square root of each slate size, averaged across slates. The intraclass correlation is the between date variance component divided by total game level variance. The permutation test reshuffles all 2,122 game totals at random across the observed slate sizes, 2,000 iterations, seed 11. The five game draw simulation samples 5 games without replacement from each qualifying date, 200 draws per date, seed 7. No park, weather, umpire, starting pitcher or posted line adjustment is applied. No result of this model is a recommendation to bet anything.