The Sacramento Premium Model: The Biggest Park Effect In Baseball Is Not Coors Field
Every handicapper adjusts for Coors Field. It is the first thing anybody learns about baseball totals, it is priced into every number the books post in Denver, and it has been true for thirty years. So when the 2026 park effects finished computing, the expectation was a table with Coors on top and a gap behind it.
That is not what the season produced. Coors is fifth.
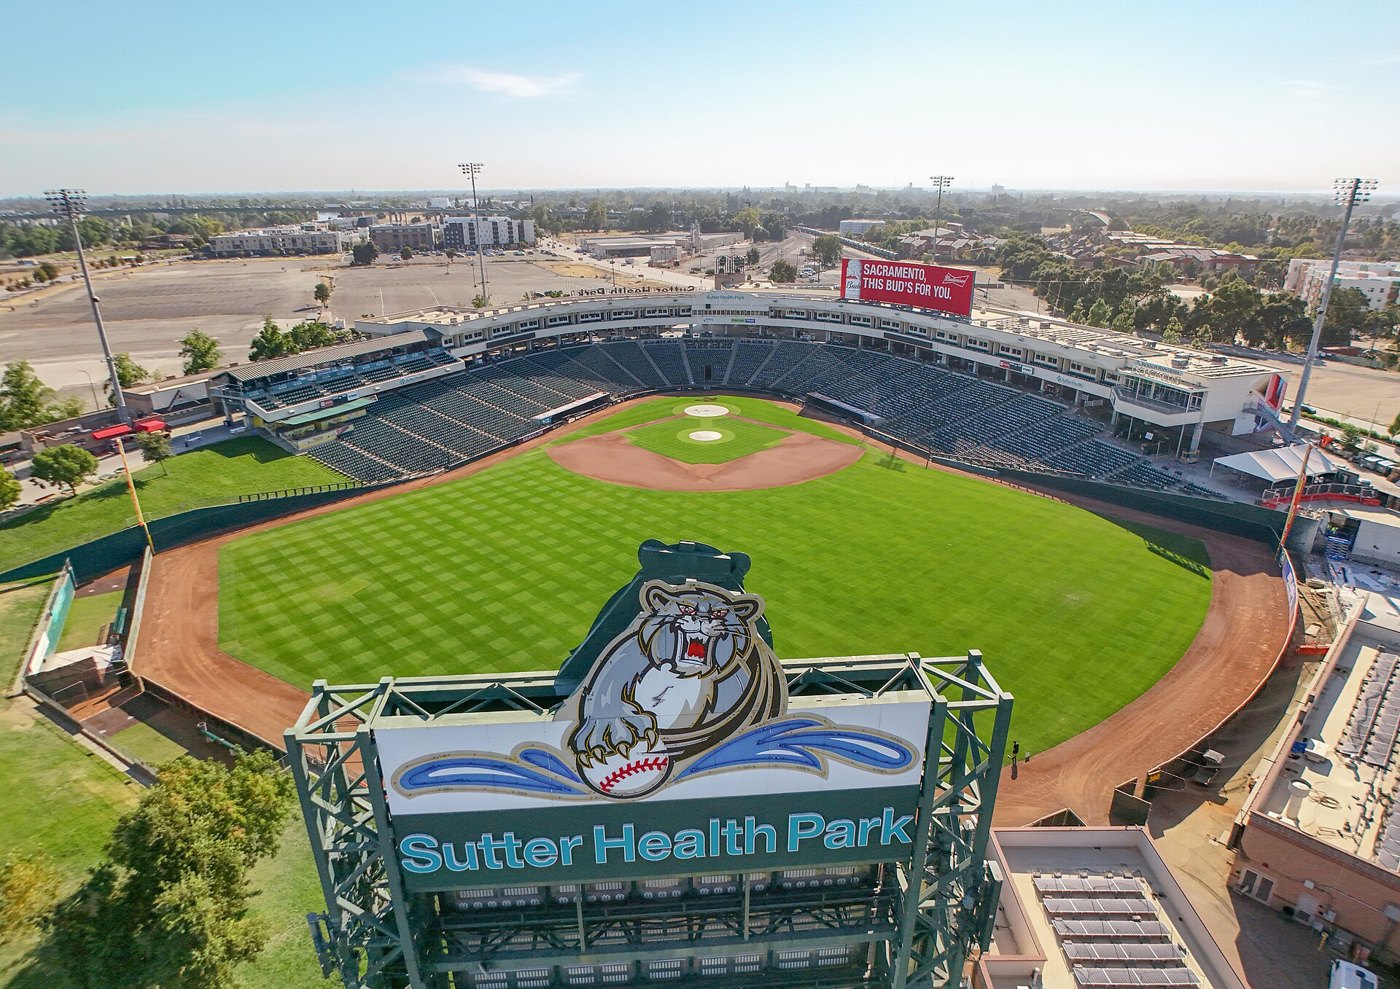
The Sacramento Premium Model measures one thing across every completed 2026 regular season game: how many combined runs a ballpark adds relative to the same team's own road games. Holding the team constant on both halves is what makes the number a park effect rather than a statement about the roster. The Athletics offense and the Athletics pitching staff are the same in both columns. Only the building changes.
The Result
Across 2,138 completed games the league average is 8.957 combined runs. Here is every park, sorted by effect.
| Home park | Home R/G | Road R/G | Park effect |
|---|---|---|---|
| Athletics, Sacramento | 11.899 | 8.473 | +3.426 |
| Philadelphia | 9.557 | 7.915 | +1.642 |
| Pittsburgh | 10.338 | 8.708 | +1.630 |
| Washington | 11.014 | 9.451 | +1.563 |
| Colorado, Coors Field | 11.214 | 9.653 | +1.562 |
| New York Yankees | 8.809 | 7.689 | +1.120 |
| Kansas City | 9.732 | 8.667 | +1.066 |
| Boston | 8.725 | 8.000 | +0.725 |
| Cleveland | 8.405 | 7.928 | +0.478 |
| Atlanta | 8.644 | 8.271 | +0.372 |
| Chicago Cubs | 9.847 | 9.606 | +0.242 |
| Tampa Bay | 8.778 | 8.586 | +0.192 |
| New York Mets | 8.753 | 8.623 | +0.130 |
| Arizona | 8.833 | 8.901 | -0.068 |
| Toronto | 8.208 | 8.451 | -0.242 |
| Chicago White Sox | 9.029 | 9.278 | -0.249 |
| Milwaukee | 8.667 | 9.014 | -0.347 |
| Los Angeles Dodgers | 8.549 | 9.000 | -0.451 |
| Houston | 9.054 | 9.522 | -0.468 |
| San Francisco | 8.594 | 9.213 | -0.619 |
| Texas | 8.099 | 8.958 | -0.860 |
| Cincinnati | 8.699 | 9.565 | -0.867 |
| Minnesota | 9.181 | 10.114 | -0.934 |
| Baltimore | 8.671 | 9.611 | -0.940 |
| Detroit | 7.882 | 8.849 | -0.967 |
| Miami | 7.986 | 9.264 | -1.278 |
| Seattle | 7.775 | 9.097 | -1.323 |
| San Diego | 7.634 | 9.113 | -1.479 |
| St. Louis | 8.333 | 9.829 | -1.495 |
| Los Angeles Angels | 7.905 | 9.485 | -1.580 |
The Sacramento figure is 2.09 times the second largest park effect in baseball and 2.19 times Coors. The gap between first and second on that table is larger than the gap between second and eighteenth.
Why It Is Not A Roster Story
The obvious objection is that the Athletics have a bad pitching staff, a 5.42 team ERA allowing 5.71 runs a game, so of course their games are high scoring. That objection is exactly what the road column exists to answer.
The same staff, the same lineup, the same 57-86 club, plays road games that average 8.473 combined runs. That is below the 8.957 league average. Take the Athletics out of Sacramento and their games are quiet. Put them back and the total moves 3.4 runs. The roster is a constant across both halves and it cancels.
The second objection is the schedule. A team's home opponents and road opponents are not the same set, and interleague play makes them less symmetric than they used to be. That is a real bias and it is worth stating, but it is a small one, and it does not plausibly produce a three and a half run gap that no other club in baseball approaches.
What A Total Of Eleven Actually Means In Each Park
Mean runs are one thing. What a bettor holds is a number, so here is the same data expressed as the historical over rate at each posted total, pushes removed from the denominator, for the two parks people actually think about.
| Posted total | Over rate in Sacramento | Over rate at Coors |
|---|---|---|
| 9 | 68.75% | 67.69% |
| 10 | 60.32% | 57.38% |
| 11 | 47.46% | 46.97% |
| 12 | 36.92% | 43.48% |
| 13 | 29.69% | 38.46% |
This is the part that should make anybody betting altitude overs uncomfortable, and it is worth saying plainly rather than softening. An eleven at Coors has gone over 46.97 percent of the time this season. At a standard -110 the break even is 52.38 percent. The naive rule that says take the over at Coors because it is Coors has been a losing rule in 2026 at that number, and the reason is not that the park stopped playing big. The park plays big. The market already knows, and it has priced eleven correctly.
Sacramento is the same story at eleven, 47.46 percent, and a worse one at twelve and thirteen. The premium exists. It is not free.
The Suppressing End Of The Table
The bottom of the list is less discussed and more useful, because pitcher friendly parks are where posted totals tend to lag reality by more.
Anaheim at -1.580, St. Louis at -1.495, San Diego at -1.479 and Seattle at -1.323 are a full run and a half of suppression each. Petco and T-Mobile are the two that appear on national broadcasts and the two whose numbers the market watches most closely, so the edge there is thinnest. Busch Stadium and Angel Stadium are quieter and their effects are just as large.
One caution on Minnesota, which reads -0.934. That is a home number of 9.181 against a road number of 10.114, so both halves are high. The park is not suppressing runs in any absolute sense. It is suppressing them relative to a team whose road games have been unusually loud.
What The Model Does Not Do
It does not separate altitude from dimensions from weather. The effect is a single number per building and it contains everything about that building, including its climate and its month by month schedule.
It does not adjust for opponent quality. Home and road opponent sets are close but not identical, and unbalanced schedules inject noise. The bias is small relative to the size of the top effect and large relative to the middle of the table, so the ranking around zero should be read loosely.
It is one season. Sutter Health Park has 69 games of history at this level. Sixty nine games is enough to establish that a plus 3.4 effect is not noise, and nowhere near enough to say what the true figure settles at. Coors has thirty years of history behind its 1.562 and Sacramento has five months.
It does not use posted totals. The over rate table compares finals against fixed round numbers rather than the line each game actually carried. A version run against posted lines is the better test of what a bettor holds, and it is the obvious next build.
What survives all four is the first table. The biggest run scoring building in baseball this season is a minor league park in Sacramento, by a margin larger than the one everybody has been adjusting for since 1995.
Data note: Results come from the MLB Stats API for the 2026 regular season, every game with a Final status and a published score from March 1 through September 5, 2026, deduplicated by gamePk to 2,138 games. Combined runs are the published final home plus away score, extra innings included at face value. Park effect is that club's mean combined runs in its home games minus its mean combined runs in its road games, so the roster appears on both sides and cancels. Over rates remove exact pushes from the denominator. No weather, umpire, starting pitcher, roster transaction or posted line adjustment is applied. No result of this model is a recommendation to bet anything.