The Run Environment Model: Team Total Fair Lines From Season Run Rates
Every book posts a team total under every game now, and the number is usually 3.5 or 4.5. The question a model should answer is simple: before anyone looks at the starting pitcher, what does the season say a given lineup scores against a given defence, and how often does that come in under the number?
The Run Environment Model does exactly that and nothing more. Two inputs, one multiplication, and a calibration table that can be checked against five months of finals. It does not know who is pitching. That is the point of building it, because it measures what the pitcher has to add.
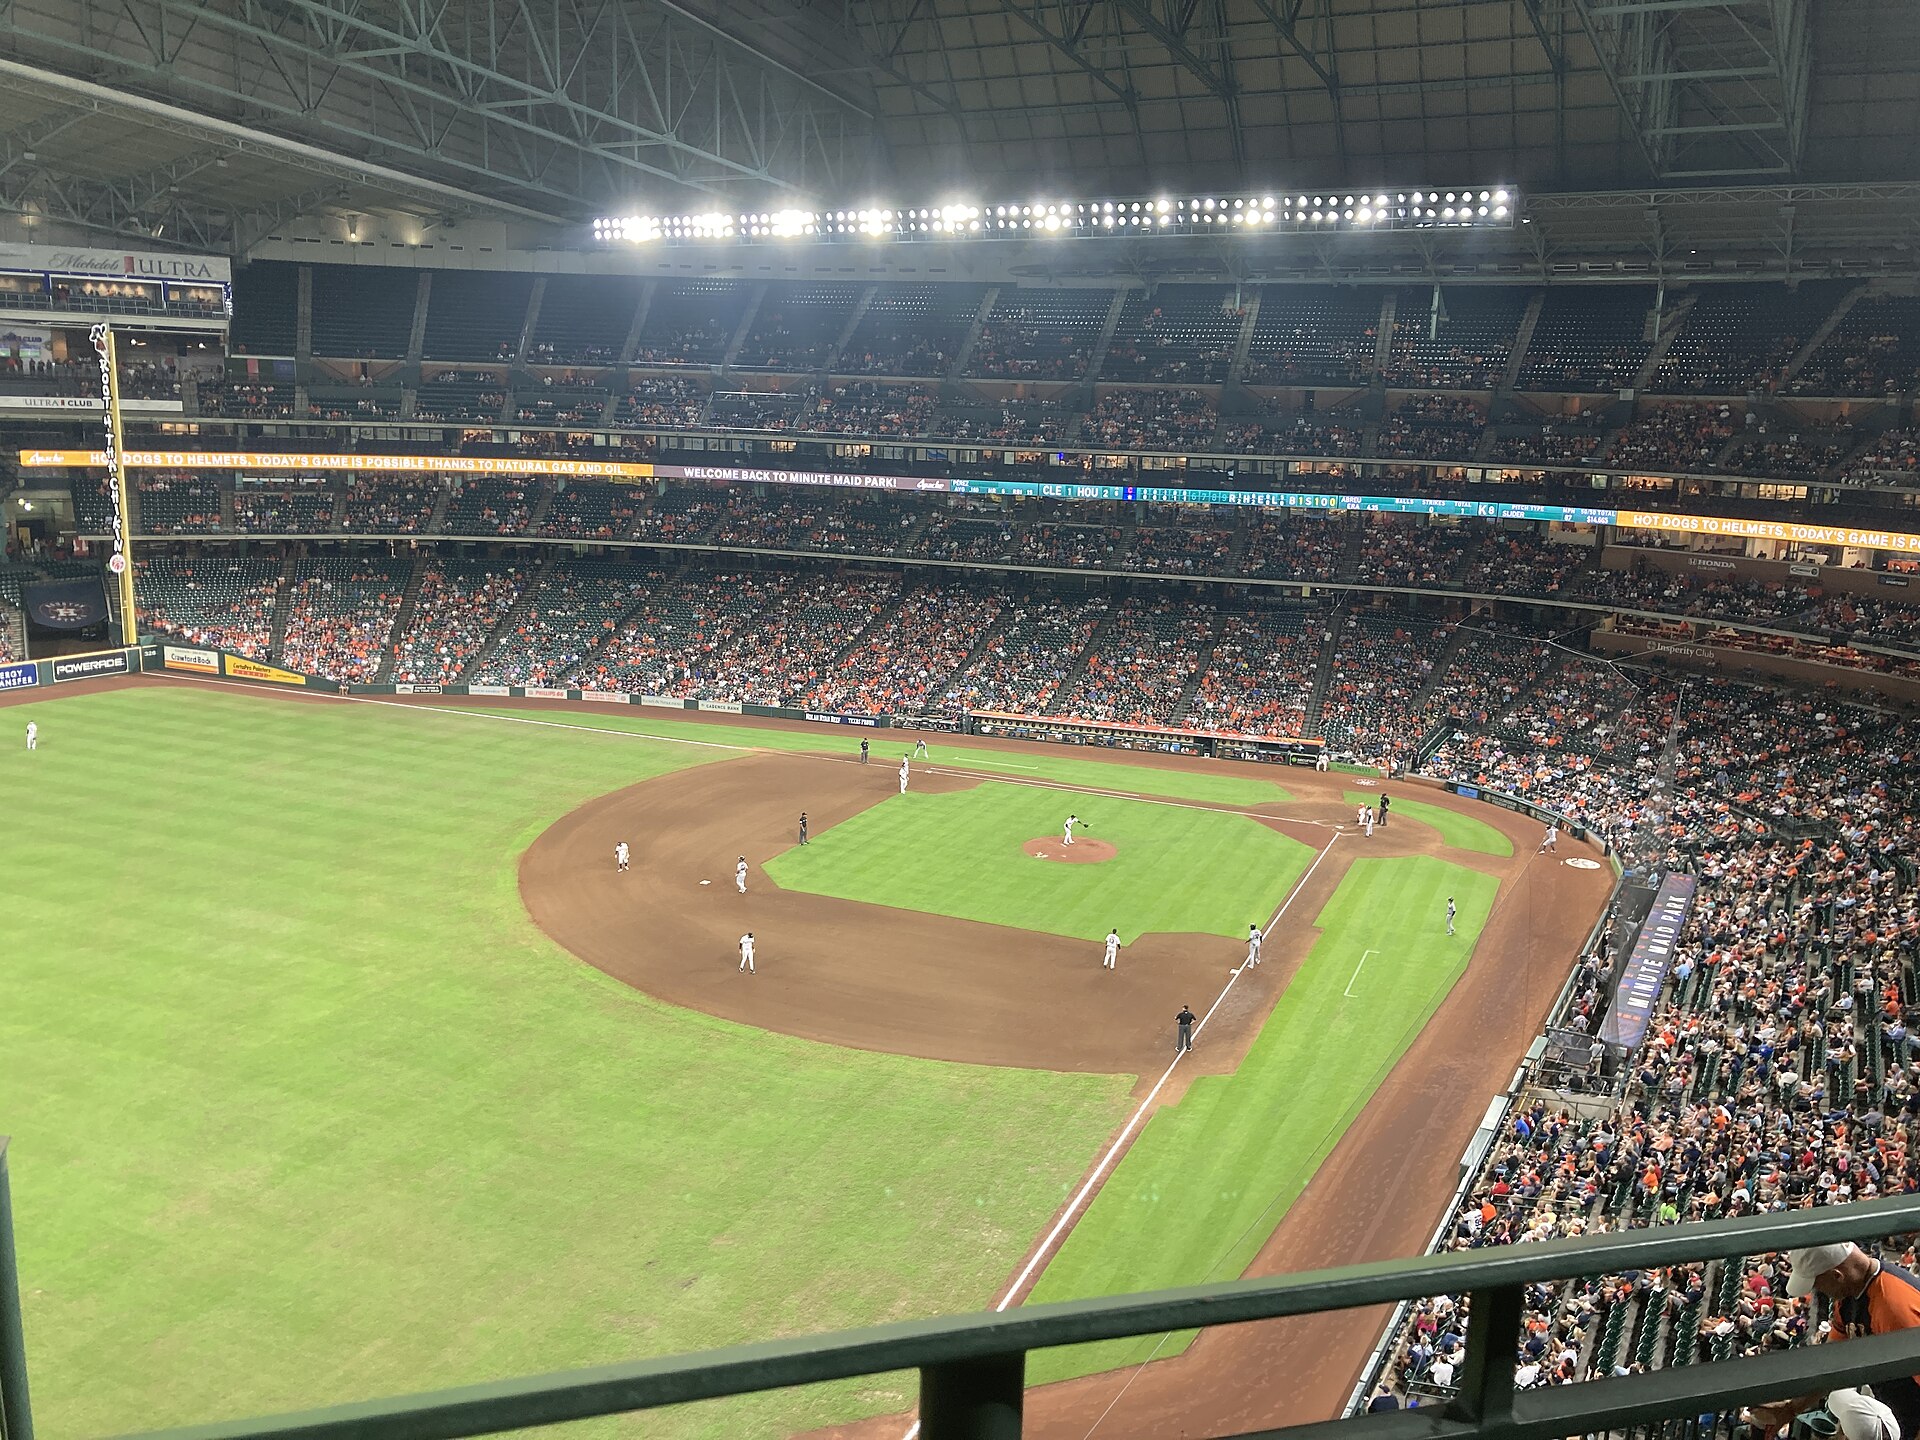
Daikin Park, Houston. The model gives the White Sox 5.19 runs against Houston's run prevention tonight, the second highest single lineup projection on the board. Photo: The Sharpest Lives, CC BY-SA 4.0, via Wikimedia Commons.
The Two Inputs
A lineup's expected runs in a game are its own season scoring rate, scaled by how much better or worse the opponent's run prevention is than the league. That is the whole model:
projected runs = team runs per game × opponent runs allowed per game ÷ league runs per game
League runs per game in 2026 through September 1 is 4.478. A lineup scoring 5.00 a game against a defence allowing 4.00 projects to 5.00 times 4.00 over 4.478, which is 4.47. The same lineup against a defence allowing 5.78, which is where the Athletics sit, projects to 6.45.
Sample: every 2026 regular season game with a Final status from March 25 through September 1, 2,083 games, each counted twice, once per lineup, for 4,166 team games. Season rates are the full season figures as of September 2, applied to every game, so the fit is in sample and flattered by hindsight. That is disclosed and it is why the calibration below is a ceiling, not a promise.
The Calibration
Sort all 4,166 team games by what the model projected and check what the lineup actually scored. The two right hand columns are the ones a team total bettor cares about: how often the lineup finished at three or fewer, and at four or fewer.
| Projected runs | Team games | Mean projected | Mean actual | Scored 3 or fewer | 4 or fewer |
|---|---|---|---|---|---|
| Under 3.5 | 113 | 3.41 | 3.51 | 59.3% | 73.5% |
| 3.5 to 4.0 | 810 | 3.79 | 3.72 | 54.2% | 67.7% |
| 4.0 to 4.5 | 1,476 | 4.27 | 4.26 | 47.1% | 58.6% |
| 4.5 to 5.0 | 1,040 | 4.74 | 4.80 | 41.0% | 53.1% |
| 5.0 to 5.5 | 460 | 5.23 | 5.19 | 35.4% | 46.5% |
| 5.5 and up | 267 | 5.89 | 5.87 | 32.6% | 43.1% |
The mean columns agree within a tenth of a run in every bucket. That is what calibration looks like: when the model says 4.74, lineups scored 4.80. The under 3.5 rate falls from 59.3 percent in the lowest bucket to 32.6 in the highest, a 27 point spread, and it falls in order at every step.
Now the other number. The correlation between the projection and the actual runs on a single team game is 0.187. The model explains about 3.5 percent of the variance in what a lineup scores on a given night. It is well calibrated on average and nearly useless on a specific game, and both of those are true at once. Baseball is that noisy at the level of one lineup and nine innings.
Tonight's Board
Run the twelve lineups in the six most bet games tonight through the model. The under rates are read straight off the calibration table for the bucket each projection lands in.
| Lineup | Own R/G | Opponent RA/G | Projected | 3 or fewer | 4 or fewer |
|---|---|---|---|---|---|
| Rangers vs Athletics | 4.10 | 5.78 | 5.29 | 35.4% | 46.5% |
| White Sox vs Astros | 4.78 | 4.86 | 5.19 | 35.4% | 46.5% |
| Brewers vs Cubs | 5.00 | 4.39 | 4.90 | 41.0% | 53.1% |
| Cubs vs Brewers | 5.37 | 3.79 | 4.54 | 41.0% | 53.1% |
| Rays vs Mets | 4.52 | 4.48 | 4.53 | 41.0% | 53.1% |
| Astros vs White Sox | 4.54 | 4.46 | 4.52 | 41.0% | 53.1% |
| Red Sox vs Mariners | 4.49 | 4.44 | 4.45 | 47.1% | 58.6% |
| Athletics vs Rangers | 4.33 | 4.40 | 4.25 | 47.1% | 58.6% |
| Guardians vs Blue Jays | 4.08 | 4.35 | 3.96 | 54.2% | 67.7% |
| Mets vs Rays | 4.08 | 4.11 | 3.74 | 54.2% | 67.7% |
| Blue Jays vs Guardians | 3.95 | 4.06 | 3.58 | 54.2% | 67.7% |
| Mariners vs Red Sox | 3.94 | 3.90 | 3.43 | 59.3% | 73.5% |
Three rows are the ones to read against tonight's posted team totals. The Cubs project to 4.54 against Milwaukee's run prevention, the best in the league at 3.79 allowed a game, and land in a bucket where a lineup scores three or fewer 41.0 percent of the time. A Cubs under 3.5 is posted around minus 120, which needs 54.5 percent. The model is 13.5 points short of that price, and the gap is exactly the size of the input it does not have: Jacob Misiorowski and his 0.75 WHIP, who has held opponents to three or fewer in 21 of 25 starts. The market is pricing the pitcher. The model is pricing the environment. The difference between them is what the pitcher is worth.
The Guardians project to 3.96 against Toronto and sit in the 54.2 percent bucket for three or fewer. A Cleveland under 3.5 at minus 137 needs 57.8 percent, so the model gets most of the way there on run environment alone before Dylan Cease is named. The Red Sox project to 4.45 against Seattle, in the 58.6 percent bucket for four or fewer, against a posted under 4.5 at minus 130 that needs 56.5. That is the one number on the board where the environment already clears the price without a pitcher.
The top of the table is the mirror image. Texas projects to 5.29 runs against the Athletics, the highest lineup projection tonight, because the Athletics allow 5.78 a game. The White Sox at 5.19 against Houston are second. Those two rows are why the Rangers moneyline and the White Sox and Astros over are priced the way they are, and the model gets there with two season rates and no names.
Data note: Results come from the MLB Stats API for the 2026 regular season, all games with a Final status from March 25 through September 1, 2026, 2,083 games and 4,166 team games. Team runs per game and runs allowed per game are season figures from the standings endpoint as of September 2, 2026, applied to every game including the ones before the rates were established, so the calibration is in sample. League runs per game is the games weighted mean, 4.478. Projected runs are team runs per game times opponent runs allowed per game divided by league runs per game, with no park, home field, or pitcher adjustment. Bucket rates are the share of team games in each projection band where the lineup scored three or fewer and four or fewer. Correlation is Pearson on all 4,166 pairs, 0.187. Team total prices quoted are the public board at 12:30 Eastern on September 2, 2026. No result of this model is a recommendation to bet anything.