The Five Inning Split Model: A Fair First Five Total From The Full Game Number
The first five innings market has quietly become one of the most posted derivative numbers in baseball. Every book that prices a game prices a first five total under it. Almost nobody checks whether the two numbers agree with each other.
That is the job of a small model. The Five Inning Split Model does one thing: it takes the full game total a book has already posted and returns the first five number that the season is actually consistent with. One input, one output, and the fit can be checked against five months of finals.
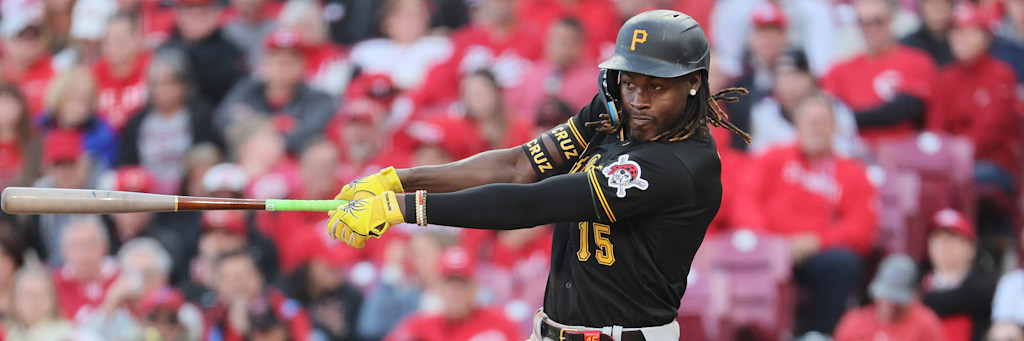
PNC Park. The model prices the first five number under Webb and Skenes without knowing either of them is pitching, which is both its discipline and its limitation. Photo: MLB.
The One Input
Everything turns on a single relationship: what share of a game's runs land in the first five innings. If that share is stable, a full game total contains all the information needed to price a first five total, because the first five number is just the full game number scaled.
Sample: 2,070 games from the 2026 regular season, every game with a Final status in the MLB Stats API from March 25 through August 31 that carried a complete five inning linescore for both clubs. Nothing excluded, nothing weighted.
| Measure | Result | Rate |
|---|---|---|
| Runs scored in the first five | 10,314 | |
| Runs scored across the full game | 18,496 | |
| First five share of all runs | 10,314 of 18,496 | 55.76% |
| Innings share for reference | 5 of 9 | 55.56% |
Those last two rows are the finding under the finding. The first five innings deliver 55.76 percent of the runs out of 55.56 percent of the innings. Starting pitchers, on a league basis, are not suppressing anything at all. Whatever edge a first five bet has, it comes from the two specific arms on the mound, never from the structure of the market.
The Fit
A flat share would price every game the same way. It does not hold across the range, so the model is fitted rather than assumed. An ordinary least squares fit of first five runs on full game runs across all 2,070 games gives:
first five = 0.272 + 0.5272 × full game
Correlation is 0.732 and the fit explains 53.6 percent of the variance in first five scoring. The residual standard deviation is 2.22 runs, which is the honest headline: this model tells you where the centre of the distribution sits and says almost nothing about any single game.
| Full game total | Games | Mean first five | Share |
|---|---|---|---|
| 7 | 234 | 3.970 | 56.7% |
| 8 | 170 | 4.388 | 54.9% |
| 9 | 185 | 5.249 | 58.3% |
| 11 | 143 | 5.958 | 54.2% |
| 14 | 80 | 8.012 | 57.2% |
| 17 | 30 | 7.933 | 46.7% |
The share holds near 55 to 58 percent through almost the whole range and then collapses at the top. Games that finish on 16 or 17 combined runs got there late, which is what a blowout looks like on a scoreboard: a starter is removed, a bullpen is emptied, and four innings do half the damage. That tail is the reason the model is a fitted line with an intercept rather than a flat percentage.
Tonight's Board
Take each posted full game total, run it through the fit, and compare the result with the first five number the same book has posted underneath it. Positive means the posted first five number sits above what the season says is fair.
| Game | Full total | Posted first five | Model fair | Gap |
|---|---|---|---|---|
| Cardinals at Dodgers | 8.5 | 5.5 | 4.75 | +0.75 |
| Mariners at Red Sox | 7.0 | 4.5 | 3.96 | +0.54 |
| Padres at Reds | 9.0 | 5.5 | 5.02 | +0.48 |
| Orioles at Rockies | 11.0 | 6.5 | 6.07 | +0.43 |
| Giants at Pirates | 7.5 | 4.5 | 4.23 | +0.27 |
| Mets at Rays | 7.5 | 4.5 | 4.23 | +0.27 |
| Athletics at Rangers | 7.5 | 4.5 | 4.23 | +0.27 |
| Blue Jays at Guardians | 8.0 | 4.5 | 4.49 | +0.01 |
| Brewers at Cubs | 10.0 | 5.5 | 5.54 | -0.04 |
| Tigers at Twins | 8.5 | 4.5 | 4.75 | -0.25 |
| White Sox at Astros | 8.5 | 4.5 | 4.75 | -0.25 |
Twelve of the fifteen posted first five numbers sit at or above the model's fair line and the board wide average gap is about a quarter of a run to the over side. That is not an accusation of mispricing. A quarter of a run against a 2.22 run residual is noise on any single game, and books have information about tonight's starters that a one input model does not have.
The Dodgers row is the one worth staring at. A full game 8.5 maps to a fair first five of 4.75, and the posted number is 5.5. Three quarters of a run of gap is the widest on the board, and it exists because the market is pricing a specific pitching matchup rather than the league average split. Whether that is right is exactly what the model cannot tell you.
The Guardians row is the opposite case and it is the honest control. A full game 8 maps to 4.49 and the posted number is 4.5. One hundredth of a run. When the market and the season agree that precisely, there is nothing here at all.
Data note: Results come from the MLB Stats API for the 2026 regular season, all games with a Final status from March 25 through August 31, 2026 that carried a complete five inning linescore for both clubs, which is 2,070 games. First five runs are the sum of linescore innings one through five for both sides. Full game runs are the final scores added, extra innings included at face value with no adjustment. The fit is ordinary least squares on all 2,070 observations with no filtering and no weighting, giving first five equals 0.2720 plus 0.5272 times full game, correlation 0.7319, residual standard deviation 2.222 runs. Full game and first five totals quoted are the prices on the public board at 12:30 Eastern on September 1, 2026. No result of this model is a recommendation to bet anything.