The Cold Plate Model: Season Run Rates Against Six Totals
Six MLB games on today's board carry a total, and the card built on them is lopsided: three bets that runs stay off the board, one bet that they do not. That is a specific claim about run environment, so it deserves a model that does nothing but estimate run environment and then reports honestly on how badly it does it.
The Cold Plate Model uses two inputs per club and nothing else: runs scored per game and runs allowed per game, both for the 2026 regular season to date. No starter, no bullpen, no park, no weather, no lineup. Each side's expected runs is the average of its own offense and the opponent's defense. Add the two sides and you have a predicted total. It is the crudest defensible model of a total that exists, and the point of publishing it is to find out how much of the work the crude version already does.
The Two Steps
Step one, the plate. For each club compute runs scored per game and runs allowed per game from every completed regular season game. Chicago's White Sox have scored 4.82 and allowed 4.47 per game across 135 games. Minnesota has scored 4.57 and allowed 5.01 across 136.
Step two, the cross. Expected runs for a club is the midpoint of its own scoring rate and the opponent's rate of runs allowed. For the White Sox at Target Field that is 4.82 and 5.01, so 4.91. For the Twins it is 4.57 and 4.47, so 4.52. Predicted total 9.43.
That is the entire model. There is no coefficient to tune, which means there is nothing to overfit, which means the backtest below is worth something.
Does It Work
The model was run over every 2026 regular season game that finished before today, using only results from strictly before each game, and only for games where both clubs had already completed 40. That is 1,435 games out of 2,042 finals.
| Measure | Result |
|---|---|
| Backtested games | 1,435 |
| Mean absolute error on the total | 3.600 runs |
| Mean bias, model minus actual | −0.021 runs |
| Correct side of a 8.5 total | 502 of 986, 50.91% |
| League average total as the predictor | 659 of 1,374, 47.96% |
| Actual league runs per game | 8.926 |
Read that table carefully, because it says two things at once. The model is almost perfectly unbiased: over 1,435 games it is off by two hundredths of a run on average, which means the two input approach captures the league's scoring level essentially exactly. And it is nearly useless at picking a side: 50.91 percent against a 8.5 line, with a mean absolute error of 3.6 runs per game. Baseball totals are mostly noise and this is what mostly noise looks like when you measure it instead of talking about it.
The one honest positive is that it beats the naive alternative. Just predicting the league's running average total gets 47.96 percent, because the league average sits at 8.926 and therefore leans over on almost everything, and the over does not win almost everything. Knowing which two clubs are playing is worth about three points of accuracy. That is a real effect and it is also nowhere near enough to bet on by itself.
Does more confidence help
Sorted by how far the prediction sits from 8.5, the answer is barely and not monotonically.
| Distance from 8.5 | Games | Correct side |
|---|---|---|
| 0.25 to 0.50 runs | 382 | 52.36% |
| 0.50 to 1.00 runs | 407 | 48.16% |
| 1.00 to 1.50 runs | 163 | 52.76% |
| More than 1.50 runs | 34 | 58.82% |
The 58.82 percent in the bottom row is on 34 games. Thirty four. At that sample a single hot week moves the number four points, so it is a curiosity and not a finding. The honest summary of the whole table is that confidence in this model does not buy accuracy until the sample gets too small to trust, which is the normal fate of a ratings only totals model.
Today's Six Games
| Game | Away expected | Home expected | Model total |
|---|---|---|---|
| Red Sox at Yankees | 4.09 | 4.10 | 8.19 |
| Mariners at Blue Jays | 4.13 | 4.16 | 8.29 |
| Royals at Guardians | 4.20 | 4.42 | 8.62 |
| Dodgers at Tigers | 4.38 | 4.08 | 8.45 |
| White Sox at Twins | 4.91 | 4.52 | 9.43 |
| Astros at Mets | 4.51 | 4.50 | 9.01 |
Target Field is the outlier and it is the only game on the slate where the model lands more than half a run clear of the league's own average. Minnesota allows 5.01 per game, the worst mark of any club here by a third of a run, and the White Sox score 4.82, the most of any club here. Two of the least run suppressing teams on the board, in the same ballpark, on the same afternoon. The model does not need a starting pitcher to notice that.
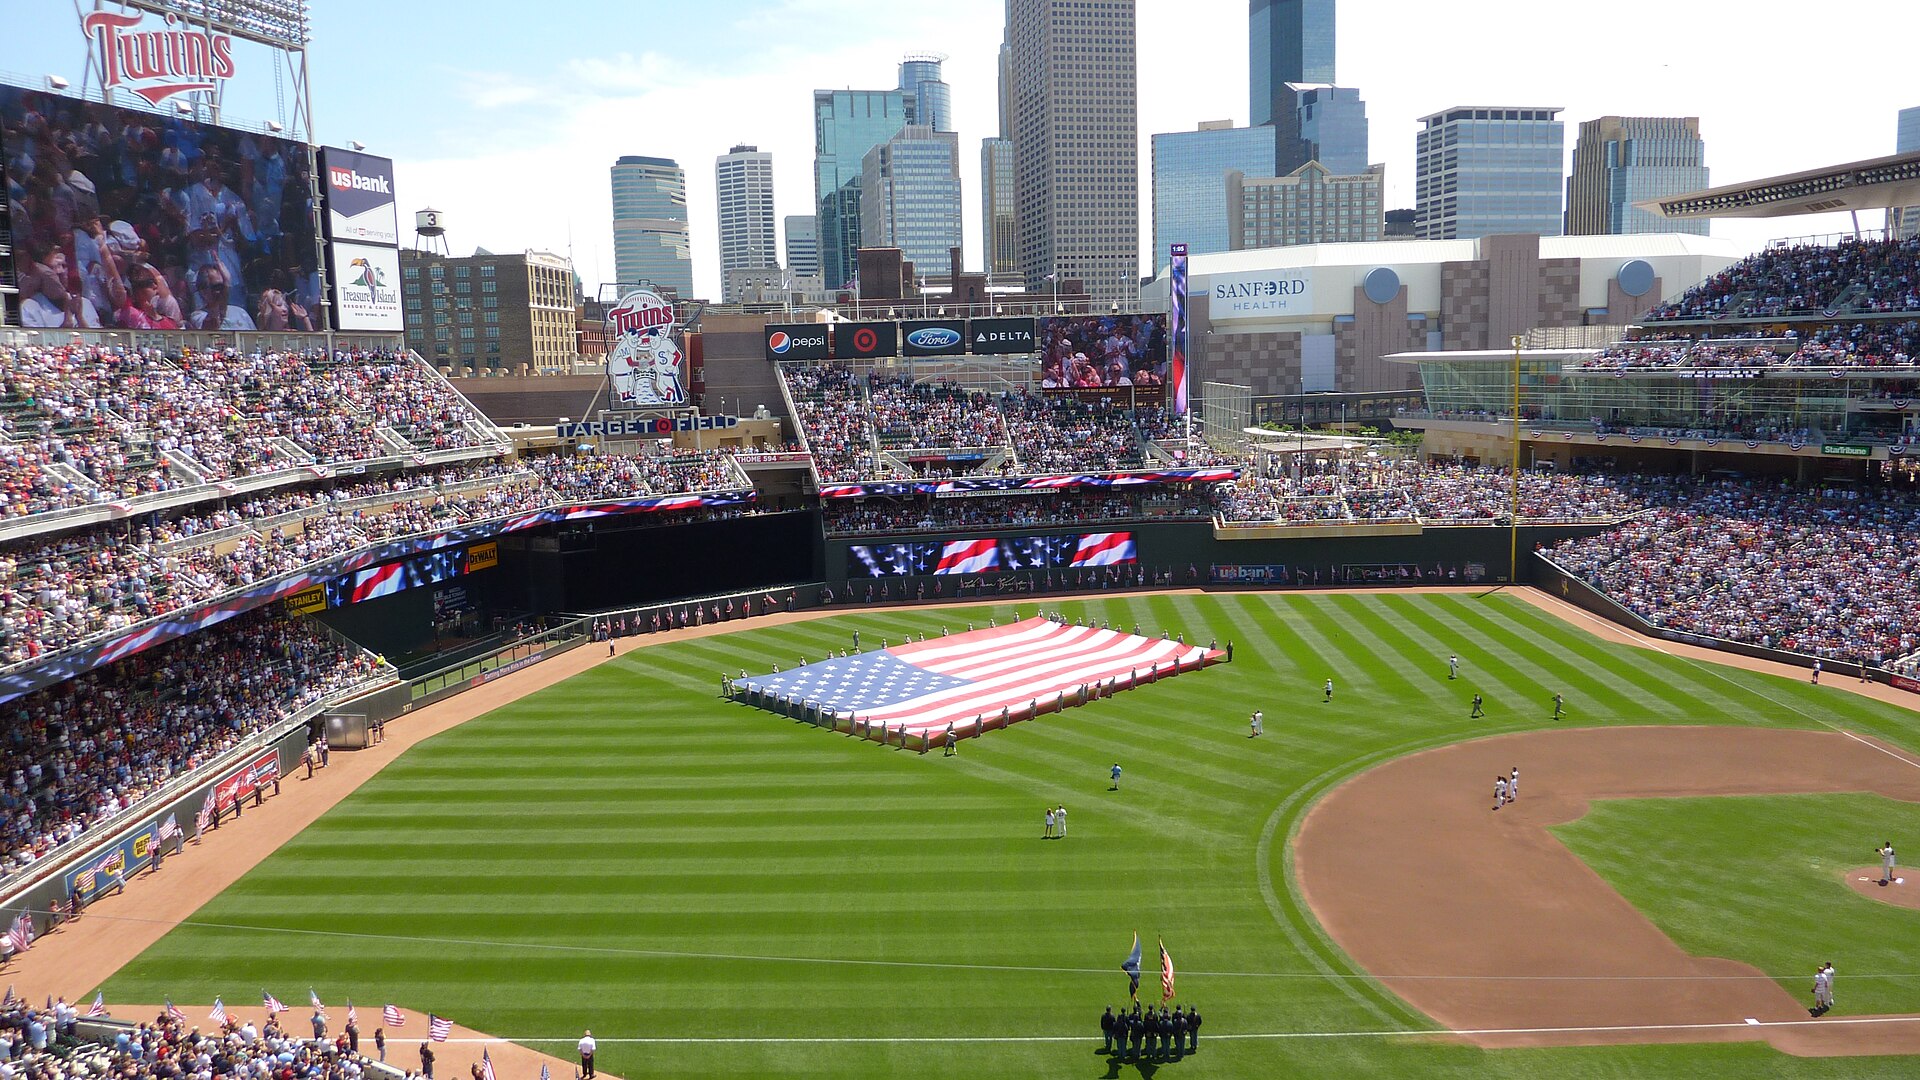
Target Field, Minneapolis. Photo by JL1Row, licensed CC BY-SA 3.0 via Wikimedia Commons.
Where The Model Disagrees With The Market
Yankee Stadium is the sharpest disagreement of the day and it runs against the crowd. Boston and the Yankees are both elite run prevention clubs by season rate, 3.74 and 3.71 allowed per game, the two best marks in this group. That is exactly why the model lands at 8.19, below the league's 8.926, and it is also why the market has the total at 8 rather than 8.5 or 9. Both the model and the market see the same thing. When a model agrees with a price, the correct output is not a bet, it is silence.
Comerica is the interesting one. The model says 8.45 because Los Angeles scores 4.88 per game, the highest figure on the board, and Detroit allows only 3.87. Those two facts pull in opposite directions and the midpoint lands close to a normal game. A model that cannot see Tyler Glasnow and Framber Valdez is going to be too high here and the season rates are exactly why: Detroit's 3.87 allowed already contains a lot of Valdez, but the model spreads it across all 134 games instead of loading it into the one he starts. This is the model's most predictable failure mode and it is worth naming rather than hiding.
Progressive Field is the third case. The model has Kansas City at 4.20 expected runs against Cleveland. That is above a 3.5 team total, and it is above it by seven tenths of a run, which by the confidence table above is worth roughly nothing. Kansas City has scored 4.30 per game across 137 games. Cleveland has allowed 4.10. Nothing in two input space says Kansas City gets held under four here. Something outside two input space might, and that is a limitation of the model rather than an argument.
What This Model Is Not
It is not a betting system. A 50.91 percent hit rate against a standard number loses money at any normal price, and it would take roughly 52.4 percent at minus 110 just to break even. Published here it serves one purpose: a floor. Any analysis that involves starters, bullpens, park and weather should beat 50.91 percent and 3.6 runs of error, and if it does not, the extra inputs were decoration.
The one thing this model says with a straight face today is that Target Field is the highest scoring environment on the board by its own numbers, by close to a full run over the next game on the list. Everything else on this slate, the model prices as roughly average, which is another way of saying it has nothing useful to add.
Data note: Runs scored, runs allowed and results come from the MLB Stats API for the 2026 regular season, all games with a Final status from March 25 through August 29, 2026, which is 2,042 games. Ratings for each game were computed only from games finishing strictly before it. The backtest is restricted to games in which both clubs had completed 40 or more, which leaves 1,435. The 8.5 comparison excludes predictions within a quarter run of 8.5, which leaves 986. Team rates quoted in the text are through August 29.