The Blowout Share Model: Opponent Run Prevention And The Two Run Margin
A whole number run line is two bets stapled together. There is the part that wins, a victory by two or more, and there is the part that refunds, a victory by exactly one. Anyone pricing one of those tickets is really answering a single question: how much of this team's win probability arrives in the blowout column instead of the one run column?
The Blowout Share Model answers that with one input. Not the pitcher, not the park, not the lineup. Just the opponent staff's season runs allowed per game. It is deliberately crude, because the useful finding is what a crude model can already see.
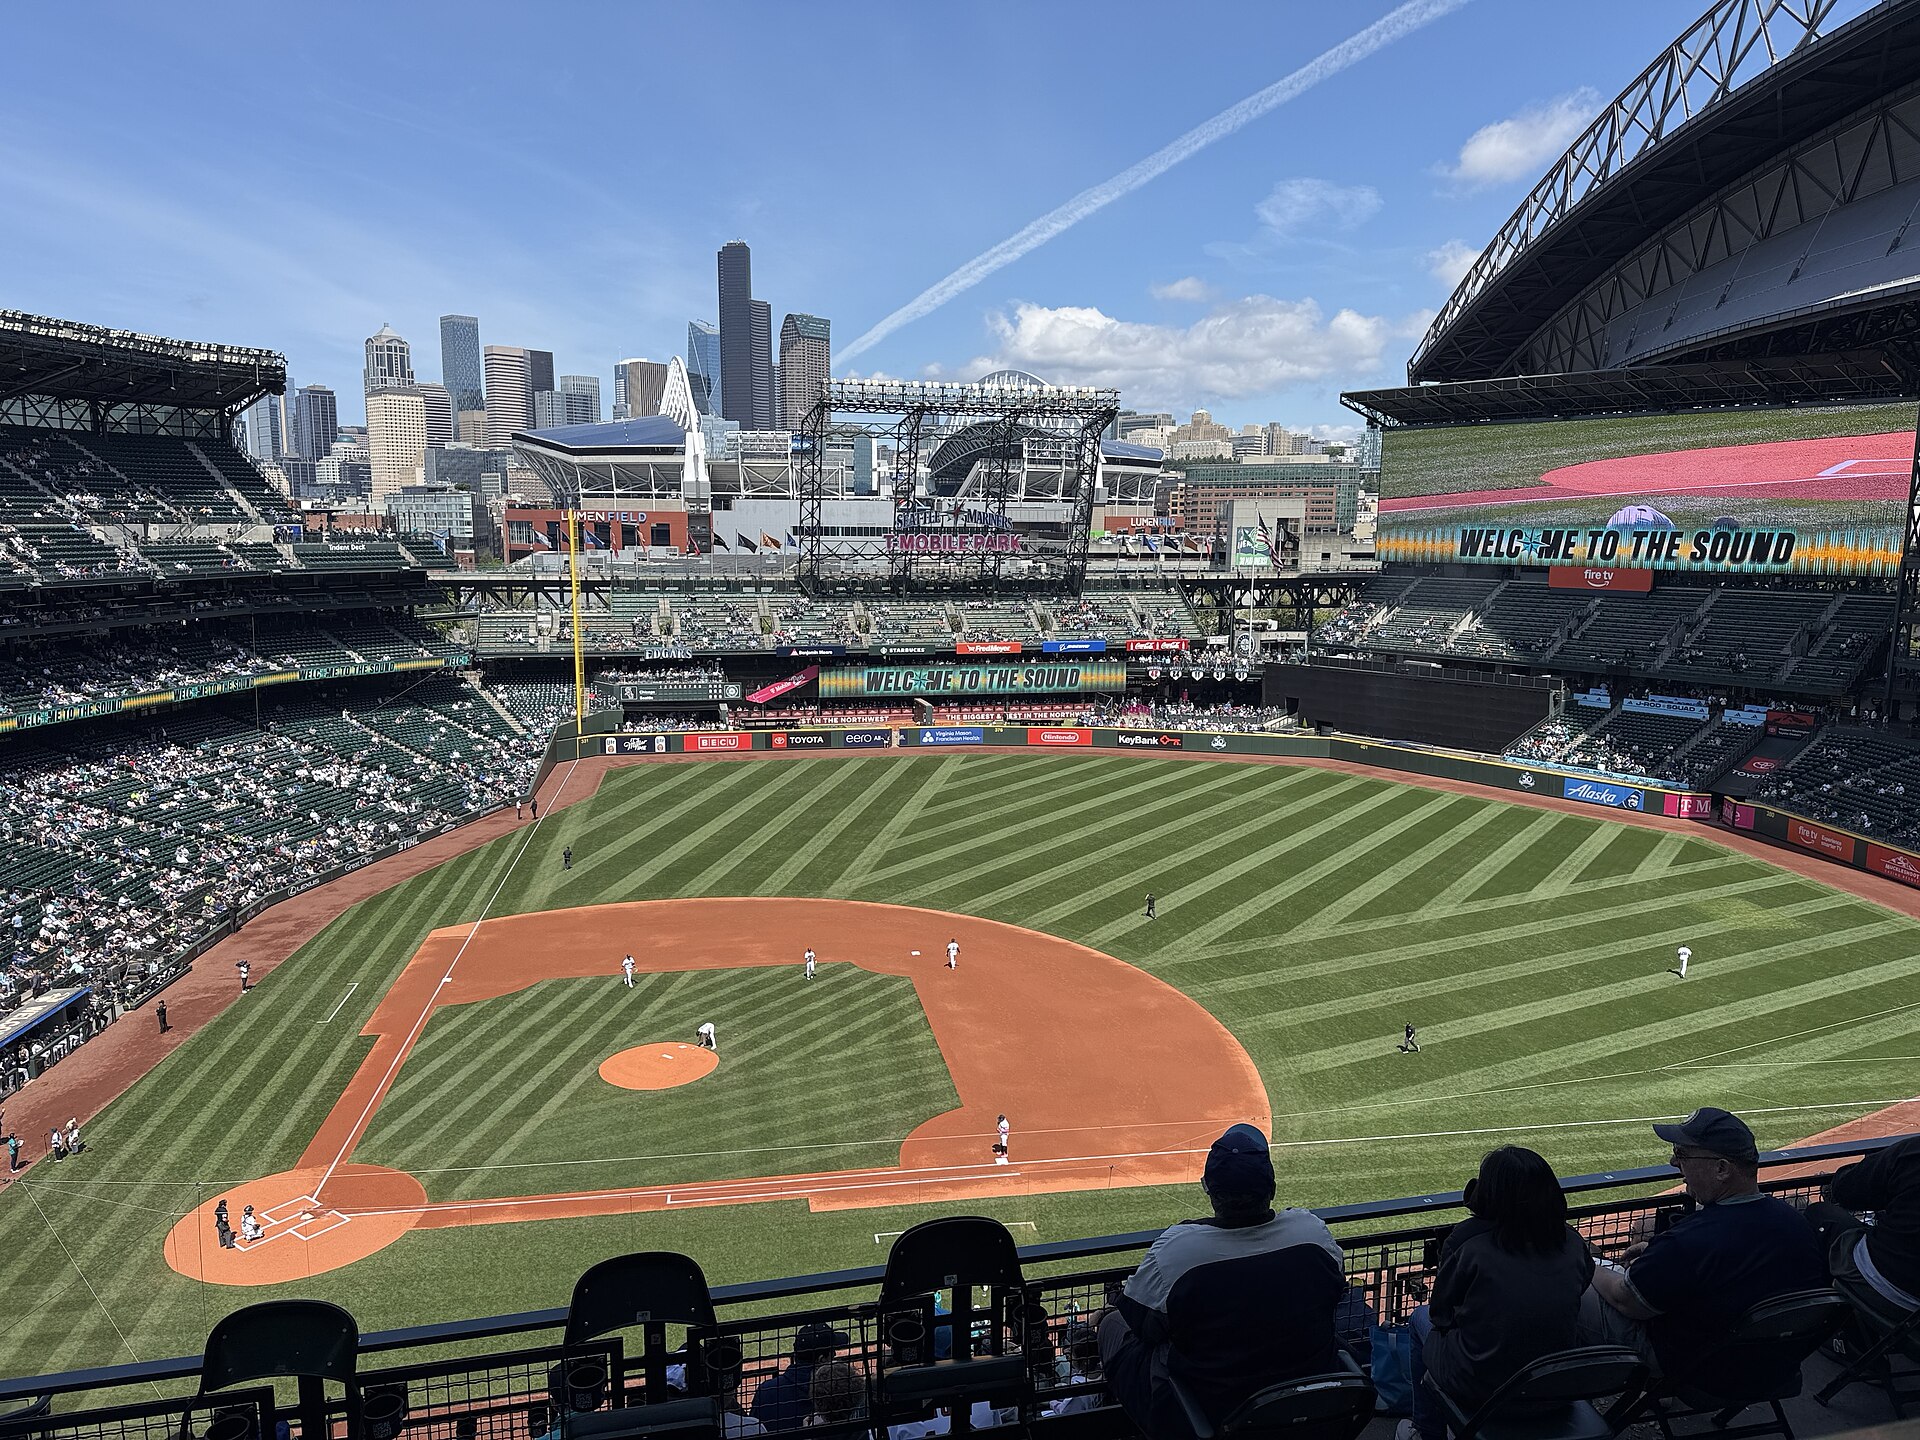
T-Mobile Park, Seattle. The Athletics allow 5.75 runs a game, the worst figure in baseball, which puts tonight's game here in the only top bucket cell on the board. Photo: Seth Tisue, CC BY-SA 4.0, via Wikimedia Commons.
The One Input
Take every 2026 regular season game with a Final status from March 25 through September 2, 2,098 games. Count each one twice, once from each dugout, for 4,196 team games. For each of those, record one number about the other side: the opponent's season runs allowed per game. Then record the outcome in three states rather than two.
win by 2 or more · win by exactly 1 · do not win
Those three states are exactly the three outcomes of a minus 1 run line: cash, push, lose. Sort the 4,196 into five buckets by the opponent's runs allowed per game and the table looks like this.
| Opponent runs allowed per game | Team games | Won by 2 or more | Won by exactly 1 | Did not win | Fair minus 1 price |
|---|---|---|---|---|---|
| Under 4.00 | 700 | 28.29% | 13.57% | 58.14% | +206 |
| 4.00 to 4.34 | 975 | 35.08% | 12.92% | 52.00% | +148 |
| 4.35 to 4.69 | 1,399 | 37.46% | 14.37% | 48.18% | +129 |
| 4.70 to 5.09 | 842 | 39.79% | 12.47% | 47.74% | +120 |
| 5.10 and up | 280 | 46.79% | 14.64% | 38.57% | -121 |
| All team games | 4,196 | 36.46% | 13.54% | 50.00% | +137 |
The Push Band Is A Constant
Read the fourth column down. 13.57, 12.92, 14.37, 12.47, 14.64. Across a range of opponent quality that moves the blowout share by 18.5 percentage points, the share of games won by exactly one run moves by two points and does not move in a direction. The best run prevention in the league and the worst produce almost identically many one run wins for the other side.
That is the finding, and it is more useful than it looks. It means the push protection in a whole number run line is worth roughly the same amount in every game on the board. It is a flat tax of about one game in seven. All of the variation, every bit of it, lives in the blowout column, and the blowout column is what the opponent staff controls.
The practical consequence: a whole number run line is not a device that gets better when a game looks safe. It gets better when the opponent's pitching is bad enough to widen margins. Those are different things, and the market prices them as if they were the same.
Tonight's Board Through The Model
Applying the single input to the September 3 slate, sorted by the opponent staff a lineup is facing.
| Lineup | Opponent staff | Opponent runs allowed per game | Model bucket | Model win by 2 or more |
|---|---|---|---|---|
| Mariners | Athletics | 5.75 | 5.10 and up | 46.79% |
| Marlins | Royals | 4.91 | 4.70 to 5.09 | 39.79% |
| White Sox | Astros | 4.82 | 4.70 to 5.09 | 39.79% |
| Giants | Pirates | 4.71 | 4.70 to 5.09 | 39.79% |
| Red Sox | Orioles | 4.65 | 4.35 to 4.69 | 37.46% |
| Dodgers | Cardinals | 4.52 | 4.35 to 4.69 | 37.46% |
| Astros | White Sox | 4.44 | 4.35 to 4.69 | 37.46% |
Seattle is the only cell on the whole board in the top bucket, and it is not close. The Athletics allow 5.75 runs a game, the worst figure in baseball, and the second worst staff in the league, Colorado at 5.68, is not playing a run line spot tonight. On the single input the model has, this is the best whole number environment available on September 3.
Where The Model Stops
It stops well short of a price, and that has to be said plainly because the gap is large.
The model's fair number for a minus 1 run line against a 5.10 or worse staff is -121. That is the unconditional figure: any team, any night, facing a bad staff. It is not a figure for a specific favourite. Seattle is a heavy favourite tonight, which should push the true number well past -121, and the run line for this game is posted around -160.
Narrow the sample and the picture gets less comfortable rather than more. Restrict to home teams facing the Athletics this season, 71 team games, and the win by two or more share is 39.44 percent against 19.72 percent by exactly one and 40.85 percent losses. Excluding pushes, that is a 49.12 percent win rate, which prices at about +104. Restrict further to home lineups scoring under 4.30 a game against a 5.10 or worse staff, 60 team games, and it is 40.00 percent by two or more, a 48.98 percent no push rate.
So the honest reading is this. The gradient in the first table is real, monotone and large. The specific cell that matters tonight is small, noisy, and sits below the posted price rather than above it. A model with one input has found the right direction and has not found an edge, and the difference between -121 and -160 is the space where a starting pitcher, a home park and a lineup's home run rate have to do all the work. This model does not measure any of those, which is precisely why it is not a recommendation.
Data note: Results come from the MLB Stats API for the 2026 regular season, every game with a Final status from March 25 through September 2, 2026, 2,098 games and 4,196 team games. Opponent runs allowed per game is the opponent's full season figure computed from those same finals as of September 3, 2026, and applied to every game in the season including the ones that produced it, so the buckets are in sample and flattered by hindsight. Extra inning runs are counted at face value, which inflates the one run band slightly under the automatic runner rule. Fair minus 1 prices are the win by two or more share divided by the sum of the win by two or more and did not win shares, converted to American odds, with pushes removed rather than counted as losses. No park, home field, starting pitcher, bullpen or weather adjustment is applied. Board prices quoted are the public numbers at 4:30 pm Eastern on September 3, 2026. No result of this model is a recommendation to bet anything.