MLB Picks, July 8, 2026
Giants-Blue Jays Under 7, the Twins Team Total Under, and the Yankees-Rays Under Headline the July 8 Run-Environment Model Board
July 8, 2026 | 11 min read | MLB Prediction
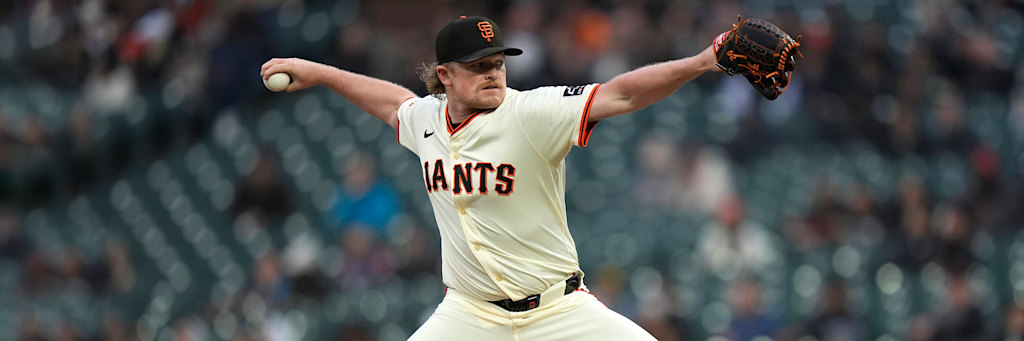
The July 8 board is a run-suppression slate, and the model's edges cluster where the WHIP and strikeout-rate gaps line up with a suppressing park. The top output is the Giants-Blue Jays under 7, driven by two of the cleaner run-prevention profiles on the card in the game's most pitcher-friendly outfield, and the supporting reads follow the same signal: sell runs where an efficient arm meets a cold offense, and isolate the single spot where a top-five run-scoring club draws below-average pitching. We will walk the whole board, but the projection engine keeps returning to Oracle Park first.
Top Output: Giants-Blue Jays Under 7 (Two Efficient Arms, One Suppressing Park)
Dylan Cease is the highest-strikeout arm on the entire slate, carrying a 2.79 ERA, a 1.18 WHIP, and 137 strikeouts. Strikeout rate is the single strongest suppressor of a rally-dependent offense in the model, because a punchout removes the productive-out and error pathways that manufacture runs without hits. Logan Webb answers with a different but equally under-friendly profile: a 3.66 ERA and a 1.17 WHIP built on ground-ball contact and elite walk avoidance, which is exactly the archetype Oracle Park rewards. When both starters keep their baserunners-per-inning near or under one, the top of the run distribution is capped before first pitch.
The park adjustment stacks on top. Oracle Park is one of the most run-suppressing environments in the majors, and the model applies a meaningful downward park factor on top of the two starters' suppression. The offense on the wrong side of that equation is Toronto, averaging just 3.98 runs per game, one of the three lowest marks in baseball. San Francisco is only modestly higher at 4.14. Two low-output offenses, two efficient starters, and a suppressing park is the cleanest under-7 projection on the slate, and it is the model's three-unit top play.
The correlated leg is the Blue Jays team total under 3.5. Isolating the lowest-scoring side of an already-low game is where the model finds its cleanest single-team projection: a league-worst-tier offense, on the road, in a pitcher's park, against a command-first starter. The projected Toronto team total lands comfortably below 3.5, which is why the under 7 and the Blue Jays team-total under are two expressions of the same underlying read.
The Team-Total Under: Twins Under 4.5 as a Line-Value Read
The Twins team total under 4.5 is a different kind of model edge, and it is worth being precise about why. Minnesota is not a weak offense; it is averaging 4.90 runs per game. The edge is the line placement and the opposing run-prevention unit. A 4.5 team total sits a full half-run under Minnesota's season scoring rate, and the Cleveland Guardians are one of the better run-prevention teams in the American League, allowing just 4.07 runs per game behind a deep, high-leverage bullpen that shortens games. When a variance-heavy offense that scores in clusters draws a staff that reliably closes out the middle innings, the run distribution has a fat left tail, and the model's projected Twins total falls under the number more often than the price implies. This is the two-and-a-half-unit line-value play, not a fade of Minnesota's talent.
The Remaining Under Reads
Yankees at Rays, Under 7
Shane McClanahan is running a 3.05 ERA with a 1.17 WHIP, and the Rays' home park has one of the most negative run-environment factors in the league. Gerrit Cole (3-3, 4.01 ERA) is the noisier input on a shortened workload, but the model does not need Cole to be elite; the McClanahan-plus-park combination caps the Tampa Bay side, and two disciplined offenses handle the rest. A total of 7 is already below the league-average game total, and the projection clears it. Pick: Under 7 (-110), 2.5 units.
Angels at Rangers, Under 7.5
Two of the lowest-output offenses in the league share a park. The Angels average 4.37 runs per game and the Rangers 4.12, and both starters suppress: Walbert Urena at a 3.03 ERA and MacKenzie Gore missing bats at a strikeout-heavy clip with 104 strikeouts. Two below-average bats and two swing-and-miss arms is a straightforward under projection. Pick: Under 7.5 (-105), 1 unit.
The Moneyline Edge: Brewers at St. Louis
The Milwaukee Brewers own the best record in the National League at 58-33 and the lowest runs-allowed rate in all of baseball at 3.63 per game, a run-prevention edge that shows up in the model as a persistent win-probability premium. Kyle Harrison (8-1, 2.82 ERA, 1.08 WHIP) extends it, opposing a St. Louis club at 47-43 with Michael McGreevy (3-7, 3.12 ERA). The model rates Milwaukee's projected win probability comfortably above the implied price. Pick: Brewers ML (-141), 1.5 units.
The Positive-Environment Outlier: Nationals Team Total Over 4.5
Every run-suppression slate has one game where the model's signal flips, and on July 8 it is in Washington. The Nationals are the highest-scoring offense on the entire board at 5.38 runs per game, and they draw a Houston pitching staff that allows 5.02 per game, one of the weaker run-prevention marks on the slate. Spencer Arrighetti (7-4, 3.81 ERA) is a functional starter, but the model weights the full-staff run-prevention profile heavily, and a top-scoring offense against a leaky staff in a neutral-to-positive park pushes the projected Nationals team total above 4.5. This is the one place on the board where the projection says buy runs, not sell them. Pick: Nationals TT Over 4.5 (-135), 2 units.
The Bottom Line
On a run-suppression slate, the model's job is to find the widest gaps between run-prevention quality and opposing offense, then price the run distribution accordingly. July 8 is stacked with those gaps: Cease and Webb over two cold offenses in the game's most suppressing park, McClanahan and the Tampa Bay run environment, and Urena and Gore over two of the lowest-output lineups in the league. The top output is the Giants-Blue Jays under 7, and the supporting core is the Twins team-total under, the Yankees-Rays under, and the Blue Jays team-total under.
If you build a single card off the model, anchor it with the Giants-Blue Jays under 7, add the Twins and Yankees-Rays unders, and layer the Blue Jays team-total under as the correlated leg. The two pivots are the Brewers moneyline, where the run-prevention edge is largest, and the Nationals team-total over, the lone positive-environment read on the board. The whole slate rewards the same discipline: when WHIP is low, strikeout rate is high, and the park suppresses, you sell runs, and you only buy them where a top offense clearly outclasses the arm.
For a deeper look at how the model weights WHIP and strikeout rate against park run environment, see our xFIP guide and the Pitcher Evaluation framework.