MLB Picks, July 7, 2026 | Run line
Phillies-Reds Under 9 Behind Zack Wheeler and the Dodgers Run Line Headline the July 7 Model Board
July 7, 2026 | 11 min read | MLB Prediction
The July 7 board is a run-suppression slate, and the model's edges cluster exactly where the pitching-quality gaps are widest. The featured output is the Phillies-Reds under 9, driven by the best starter on the entire card, and the supporting plays follow the same signal: sell runs where an elite arm meets a below-average offense, and lay the run line where the pitching and run-prevention edges compound. We'll walk the whole board, but the projection engine keeps returning to Cincinnati first.
Featured Output: Phillies-Reds Under 9 (Wheeler Caps the Run Environment)
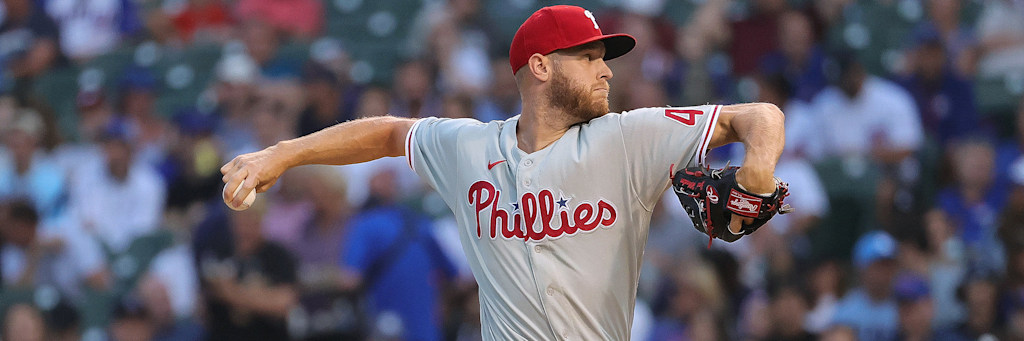
Zack Wheeler is the highest-graded starter on the slate by a comfortable margin. He carries a 2.36 ERA with a 0.94 WHIP, and that WHIP is the number that matters most for a total. A starter who keeps his baserunners per inning under one is capping the top of the run distribution before the game even starts, because rally chains require traffic and Wheeler simply does not allow it. The park works against him on paper, Great American Ball Park is one of the friendlier home-run environments in the National League, but the model weights a WHIP-and-strikeout profile like Wheeler's heavily enough to override the park adjustment.
The other side is Andrew Abbott, at 5-4 with a 3.88 ERA, who is not the problem for an under. He is a functional mid-rotation arm who keeps the Phillies from teeing off early, which is exactly the profile the under wants opposite Wheeler. Cincinnati's offense is averaging just 4.18 runs per game, and against a starter who suppresses baserunners the way Wheeler does, the model projects the Reds' side of the total to compress hard. When both projected team totals fall and one starter is elite, the game total under is the clean number. The model reads the under 9 at -114 as the top-rated play on the board.
The Run Line: Dodgers -1.5 vs a Rockies Collapse
The second-highest edge on the board is a compounding-signal play. The Los Angeles Dodgers are 60-32, the best record in baseball, and they own the stingiest run prevention in the league at 3.55 runs allowed per game. They hand the ball to Justin Wrobleski, 10-2 with a 2.80 ERA. The Colorado Rockies are 37-55 with the worst run prevention in the sport at 5.76 runs allowed per game, and away from the altitude of Coors Field their offense falls apart. Michael Lorenzen (3-9, 6.91 ERA) does not slow the Dodgers down. This is the rare spot where the pitching edge, the run-prevention edge, and the road-offense penalty all point the same way, which is why the model is comfortable laying the -1.5.
The correlated leg is the Rockies team total under 2.5. A road Colorado lineup against a sub-3.00 ERA starter and the league's best run-prevention unit is the single lowest team-total projection on the slate. Stack the run line with the Rockies team total under and you are betting the same underlying read twice.
The Team-Total Unders: Where Strikeout Rate Meets a Weak Bat
Angels Team Total Under 3.5 (vs deGrom)
Jacob deGrom is 7-5 with a 3.48 ERA and a 0.99 WHIP, and his strikeout rate sits above ten per nine. The model treats strikeout rate as the strongest single suppressor of a rally-dependent offense, and the Angels at 36-55 and 4.38 runs per game are exactly that profile. The projected Angels team total lands well under 3.5. The correlated NRFI in the same game leans on Jose Soriano's 3.00 first-inning ERA and two offenses that rank near the bottom in early scoring. Picks: Angels TT Under 3.5, Angels-Rangers NRFI.
Athletics Team Total Under 3.5 (vs Skubal)
Tarik Skubal is running a 3.15 ERA with a 0.91 WHIP and 75 strikeouts at a rate above ten per nine. The Athletics are a boom-or-bust offense whose run distribution collapses against high-strikeout, low-WHIP arms. The model projects the Athletics' team total below 3.5 with confidence. Pick: Athletics TT Under 3.5.
Braves Team Total Under 3.5 (vs Skenes)
The counterintuitive one. Atlanta is the far better team at 52-37, but Paul Skenes and his 3.62 ERA and 119 strikeouts at a rate above eleven per nine flatten even quality offenses. The value is on the Braves' run projection, not the game outcome. Pick: Braves TT Under 3.5.
Blue Jays Team Total Under 3.5 (at San Francisco)
Toronto is averaging a slate-low 3.92 runs per game, and Oracle Park is a run-suppressing environment. A league-worst offense in a pitcher's park on the road is a structural team-total under. The plus-money price makes it the best value on the board. Pick: Blue Jays TT Under 3.5 (+110).
The Remaining Reads
Yankees at Rays, Under 8
Will Warren (7-3, 3.73) opposes Ian Seymour (5-1, 4.02) in a Tampa Bay park that has historically suppressed run scoring. Two above-average arms and a disciplined Rays club at 52-36 push the total under. Pick: Under 8.
White Sox Moneyline (vs Boston)
A pure record-versus-price read. The White Sox are 47-42 and above .500, the Red Sox are 40-48 and below it, and the home team with the better record is priced as a plus-money dog at +105. The model flags the number as too long. Pick: White Sox ML +105.
Giants Moneyline (vs Toronto)
San Francisco at -102 is a near pick'em against the league's lowest-scoring offense in a park that favors the pitcher. The Giants moneyline pairs naturally with the Blue Jays team-total under as a same-game run-environment stack. Pick: Giants ML -102.
The Bottom Line
On a run-suppression slate, the model's job is simple: find the widest gaps between starter quality and opposing offense, and price the run distribution accordingly. July 7 is stacked with those gaps. Wheeler's sub-1.00 WHIP over the Reds, deGrom and Skubal over two rally-dependent offenses, Skenes over even a good Braves lineup, and Wrobleski plus the league's best run prevention over a road Rockies club. The featured output is the Phillies-Reds under 9, and the supporting core is the Dodgers run line, the two team-total unders against deGrom and Skubal, and the Rockies team-total under.
If you build a single card off the model, anchor it with the Phillies-Reds under 9, add the Dodgers run line with the correlated Rockies team-total under, and layer the Angels and Athletics team-total unders. The whole board rewards the same discipline: when the strikeout rates are high and the WHIPs are low, you sell runs and lay the arms that prevent them.
For a deeper look at how the model weights WHIP and strikeout rate against park run environment, see our xFIP guide and the Pitcher Evaluation framework.