Ohtani vs Cease: Dodgers-Blue Jays World Series Rematch Creates the Most Compelling Pitching Duel on the April 8 Slate
April 8, 2026 | 8 min read | MLB Prediction
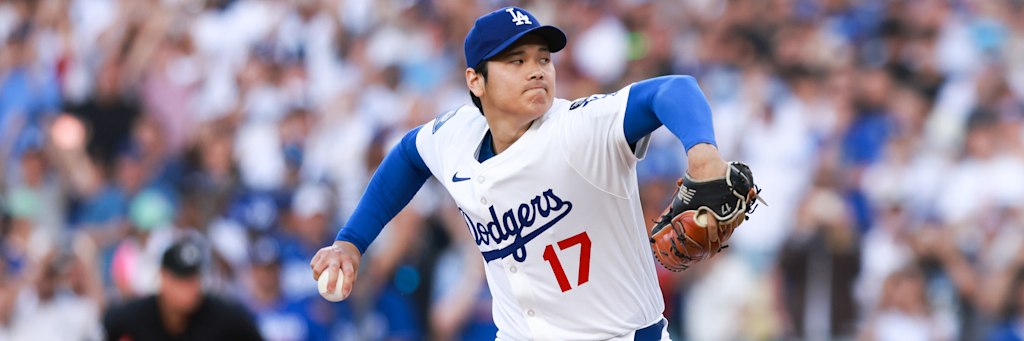
The Los Angeles Dodgers send Shohei Ohtani to the mound at Rogers Centre for the finale of a three-game series against the Toronto Blue Jays, creating a World Series rematch pitching duel against Dylan Cease that the projection model identifies as the most analytically compelling matchup on the entire 15-game April 8 slate. Ohtani's 0.00 ERA through one start (six scoreless innings, six strikeouts, one hit) collides with Cease's 2.79 ERA and 18 strikeouts through two starts in his new Blue Jays uniform, and the model's run environment projection suggests the Dodgers' offensive firepower creates a meaningful gap in win probability despite both pitchers profiling as above-average arms.
The Pitching Profiles: Two Power Arms with Divergent Arsenals
Ohtani's return to the mound in 2026 has been the headline story of the early season. After a full year away from pitching while recovering from UCL surgery, his debut start against Cleveland was dominant: 6.0 IP, 1 H, 0 ER, 3 BB, 6 K on just 87 pitches. The efficiency is what stands out most in the Statcast profile. His fastball velocity was sitting at its pre-injury levels, his splitter generated whiffs at elite rates, and his pitch tunneling metrics showed no degradation from the time away. He's not easing back in. He's already operating at peak output.
Cease brings a different but equally compelling profile. His Blue Jays debut was historic: 12 strikeouts in 5.1 innings, the most by any pitcher in a Toronto debut, breaking David Price's record of 11 set in 2015. Through two starts, Cease has punched out 18 batters, and his four-seam fastball has generated elite vertical movement. But a 1.34 WHIP suggests the command hasn't been as crisp as the swing-and-miss numbers imply. He's allowing hard contact in spots between the strikeouts, which creates vulnerability against a Dodgers lineup that ranks first in MLB in batting average (.292) and slugging (.501).
Run Environment Projection: Rogers Centre Amplifies the Offensive Gap
Rogers Centre with the retractable roof closed creates a neutral-to-hitter-friendly run environment. Unlike the outdoor cold-weather parks that suppress offense in early April, Rogers Centre maintains consistent indoor conditions that keep fly-ball carry at summer-level baselines. The model applies no cold-weather suppression adjustment here, which matters significantly when projecting run output for a Dodgers lineup that's been crushing the ball through the season's first 11 games.
The offensive asymmetry between these two clubs is stark. Los Angeles enters with a 9-2 record, a .292 team batting average (first in MLB), and a .501 slugging percentage that's also the best in the sport. They've scored runs at a rate that's been consistently above the league average since Opening Day. Toronto, by contrast, is hitting just .231 as a team with a .348 slugging percentage, numbers that rank in the bottom third of baseball. The Blue Jays offense has not generated consistent hard contact, and facing Ohtani's velocity-splitter combination is unlikely to fix that problem.
The model projects the Dodgers to generate 3.6-4.2 runs against Cease and the Toronto bullpen, driven by the lineup's ability to make hard contact even against high-velocity arms. The Blue Jays project for 2.0-2.6 runs against Ohtani and the Dodgers' relief corps, with the lower floor reflecting Ohtani's ability to completely neutralize a lineup when his splitter is working. The combined projection of 6.0-6.5 runs aligns closely with the posted total of 7.5.
| Factor | LAD Projection | TOR Projection | Combined |
|---|---|---|---|
| Baseline Run Expectancy | 4.8 | 3.4 | 8.2 |
| SP Adjustment | -0.8 | -1.2 | -2.0 |
| Park Factor (Indoor) | +0.1 | +0.1 | +0.2 |
| Final Projection | 4.1 | 2.3 | 6.4 |
World Series Context: What the October Data Reveals
These two clubs played a seven-game World Series last October that the Dodgers won 4-3, clinching back-to-back championships for the first time since the 2000 Yankees. The series was defined by dominant pitching performances, including Yoshinobu Yamamoto's MVP-winning three wins and 1.02 ERA, and an epic 18-inning Game 3 that was the second-longest World Series game by time. That postseason data provides a real-world sample of how these two organizations match up at the highest level.
The regular-season rematch data from earlier in this series confirms what the October results suggested: the Dodgers have a clear offensive talent advantage. Los Angeles took the first game of this series 14-2, with five home runs including two from catcher Dalton Rushing. While one-game samples carry enormous variance, the underlying metrics support the notion that the Dodgers' lineup is deeper and more dangerous than Toronto's at every point in the order.
The model weights recent regular-season performance more heavily than postseason data for these projections, but the October context matters for one specific reason: it established that the Dodgers can generate runs against elite Toronto pitching. If they scored against the Blue Jays' best arms in the highest-pressure environment in baseball, the expectation that they'll generate runs against Cease in an April series finale is well-founded in the data.
Win Probability Output: Model Confidence and Key Variables
The projection model assigns a 59.8% win probability to Los Angeles in this matchup, which aligns closely with the implied probability derived from the -150/+124 pricing. The model and the market are in near-perfect agreement that the Dodgers are clear favorites, but neither is assigning blowout-level confidence. The gap narrows significantly because Ohtani is on a managed workload, likely capped at 80-90 pitches and 5-6 innings, which shifts more of the game's variance to the bullpen phase.
The key variable the model identifies is Ohtani's pitch count efficiency. In his debut, he needed just 87 pitches for six innings, which is an excellent rate. If he can replicate that efficiency against Toronto, the Dodgers get deep into the game with their ace on the mound and hand a lead to one of the deepest bullpens in the National League. If he's less efficient, walking three or four and leaving after four innings, the game becomes a bullpen-versus-bullpen contest where the variance widens considerably.
The Bottom Line
The model projects a combined run expectancy of 6.4 runs, which sits a full run below the posted total of 7.5. The convergence of two above-average starting pitchers, Ohtani's pitch-count management limiting his exposure, and a Toronto offense that ranks in the bottom third of the league in slugging percentage all create a run environment that skews under. Los Angeles has the offensive depth to generate runs against Cease, but the model does not project a high-scoring game from the Blue Jays' side. The most probable final score clusters around 4-2 and 3-2 Dodgers, both outcomes that fall under the posted total. The under 7.5 at -112 represents the model's highest-confidence projection on this matchup.
For context on how starting pitcher projections and run environment models are built, see our guide to how MLB games are predicted.