 @
@
Featured writeup: Brewers vs Dodgers. Each row links to the game article with pitcher photos, rate tables, and the park facts.
Live model card. Same URL every day. Priced at publication, not after the market moves. Full copula writeup: shared-factor model for this card.
All 3 legs still live. Nothing settled yet. Pending is not a win. Every leg is priced at the number posted on the BetLegend tracker, and each row links to the full game writeup.
| Pick | Odds | Units | Result | Source |
|---|---|---|---|---|
| Guardians ML | -120 | 1.5u | pending | Full article |
| Rays team total under 3.5 | -150 | 2.5u | pending | Full article FEATURED |
| Dodgers ML | -149 | 1u | pending | Full article |
Each row is a published price from the Thursday, October 15, 2026 model card. If a listed starter is scratched, that leg is void, not silently regraded. Closing-line value is logged separately from win/loss on the public record.
HR prop hub. Today's sides are on the main card.
First-inning no-run model page.
K lines vs starter K-BB.
F5 moneylines and totals.
Every game writeup lives here in one running thread, newest first. Writeups from before October 2026 keep their own pages and are listed at the bottom.
Unlisted vs Tyler Glasnow at UNIQLO Field at Dodger Stadium
Published October 15, 2026 · MLB Prediction Data Lab
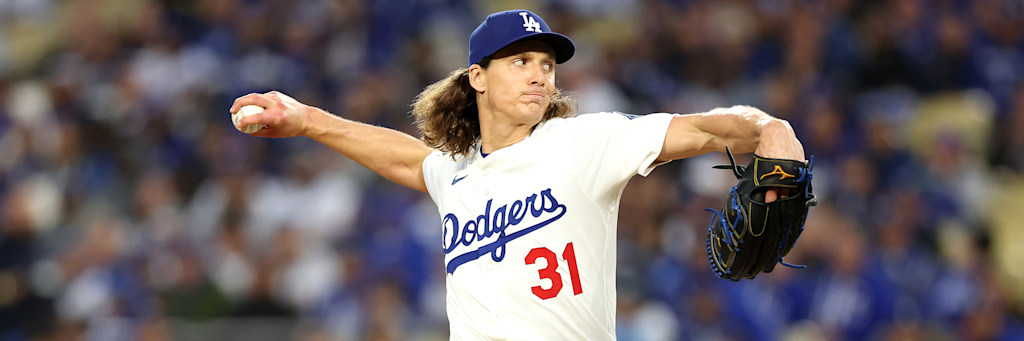
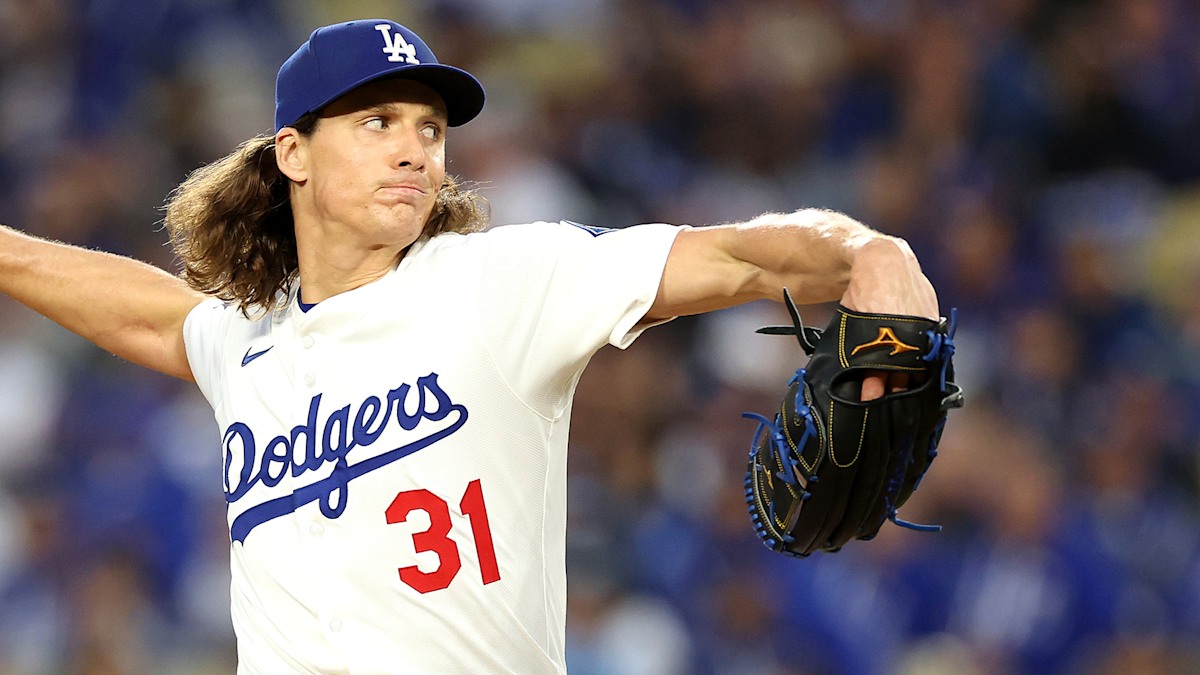
The moneyline on Dodgers at -149 is a run-prevention bet first. Unlisted projects 3.93 earned runs allowed across a 5.50-inning start plus relief; Tyler Glasnow projects 3.54. The side that prevents more does not have to outslug anyone.
Full slate: MLB picks today, October 15, 2026.
Milwaukee Brewers (3–0) at Los Angeles Dodgers (0–3), UNIQLO Field at Dodger Stadium, Los Angeles. Unlisted, a starter, is listed for the visitors. Tyler Glasnow, a right-hander, is listed for the home club. Void the play if either listed starter is scratched.
| Side | Listed starter | Record | Park |
|---|---|---|---|
| Brewers | Unlisted | 3–0 | UNIQLO Field at Dodger Stadium |
| Dodgers | Tyler Glasnow | 0–3 | Open, grass |
Rate statistics expressed per nine innings reward pitchers who work deep. Expressing them as a share of batters faced removes that distortion. Unlisted has faced — hitters. Tyler Glasnow has faced 288.
| Starter | BF | K% | BB% | K−BB | K/BB | Pitches/BF |
|---|---|---|---|---|---|---|
| Unlisted | — | — | — | — | — | — |
| Tyler Glasnow | 288 | 34.0 | 8.7 | 25.3 | 3.92 | 3.99 |
| Starter | W-L | ERA | IP | WHIP | K/9 | BB/9 | HR/9 | Opp AVG |
|---|---|---|---|---|---|---|---|---|
| Unlisted () | —-— | — | — | — | — | — | — | — |
| Tyler Glasnow (R) | 5-2 | 3.53 | 74.0 | 0.95 | 11.92 | 3.04 | 0.85 | .175 |
Unlisted sits at a — ERA with a — WHIP and — walks in — innings. Tyler Glasnow sits at a 3.53 ERA with a 0.95 WHIP and 25 walks in 74.0 innings. Walks stabilize faster than earned runs, so the walk column is the more trustworthy August reading.
Season aggregates hide the last month. These are the prior starts, excluding today's outing so the table does not leak a result into a published prediction.
No prior 2026 game log is posted yet for Unlisted.
| Tyler Glasnow — last starts | IP | ER | K | BB | H | HR | Pitches |
|---|---|---|---|---|---|---|---|
| 2026-08-30 | 7.0 | 1 | 6 | 1 | 2 | — | 85 |
| 2026-09-05 | 6.0 | 4 | 8 | 3 | 6 | — | 96 |
| 2026-09-12 | 4.0 | 4 | 7 | 4 | 5 | 1 | 91 |
| 2026-09-18 | 6.0 | 2 | 10 | 2 | 3 | 1 | 98 |
| 2026-09-24 | 6.1 | 3 | 11 | 2 | 3 | — | 91 |
Brewers have scored 832 runs in 162 games (5.14 per game) with a .744 OPS. Dodgers have scored 801 in 162 (4.94) with a .762 OPS. The pitching staffs have allowed 3.81 and 3.70 runs per game.
| Club | Record | R/G | OPS | Staff ERA | Staff WHIP | RA/G |
|---|---|---|---|---|---|---|
| Brewers | 3–0 | 5.14 | .744 | 3.51 | 1.18 | 3.81 |
| Dodgers | 0–3 | 4.94 | .762 | 3.55 | 1.14 | 3.70 |
Unlisted averages 5.50 innings per start. Tyler Glasnow averages 5.69. Weight each starter's own earned run average across that length, then hand the remainder of the nine innings to his club's season staff rate. That is a conservative relief proxy — it mixes rotation and bullpen — and it is stated as a limitation, not hidden.
| Side | Starter IP | Starter ERA | Relief IP | Staff ERA | Projected ER |
|---|---|---|---|---|---|
| Brewers (Unlisted) | 5.50 | 4.20 | 3.50 | 3.51 | 3.93 |
| Dodgers (Tyler Glasnow) | 5.69 | 3.53 | 3.31 | 3.55 | 3.54 |
| Combined | 7.47 |
A combined 7.47 projected earned runs. Unearned runs are ignored. Neither starter hits his average length every night. The opposing lineups are not in the formula; they sit in the table above.
UNIQLO Field at Dodger Stadium is listed at 330 feet to left, 385 feet to left center, 395 feet to center, 385 feet to right center, 330 feet to right, on grass, open at 515 feet above sea level with a listed capacity of 56,000. Park dimensions do not decide a total by themselves. They decide whether a walk plus a ball in the air becomes two runs or a long out.
Moneyline edges this thin die when the length assumption fails. If the better starter is out in the fourth, the staff rate takes over and the partition no longer applies.
A short outing from the starter on the backed side, or a crooked inning against the relief bucket that the partition treats as average, is the miss. The model is only as good as the length assumption of 5.50 and 5.69 innings.
Dodgers ML at -149, 1 units. A price of -149 implies a 59.8% break-even. Grade it against this published number. If a listed starter is scratched, the play is void.
Unlisted for Brewers. Tyler Glasnow for Dodgers. Those names come from the MLB probable-pitcher feed, not from a guessed rotation.
Earned run average is a counting result. Strikeout and walk rates as a share of batters faced describe the process that produced it, and they stabilize on a smaller sample. Unlisted at — points of K−BB separation versus Tyler Glasnow at 25.3 is the comparison ERA hides.
Against the published price, on the public record. Pending is not a win. Today's full card lives at a stable URL: mlb-picks.html.
Pick, odds, and unit size come from the BetLegend daily tracker. Probable starters, season rates, and venue facts are from the MLB Stats API. Educational analysis. 18+ only. 1-800-GAMBLER.
Robert Gasser vs Blake Snell at UNIQLO Field at Dodger Stadium
Published October 14, 2026 · MLB Prediction Data Lab
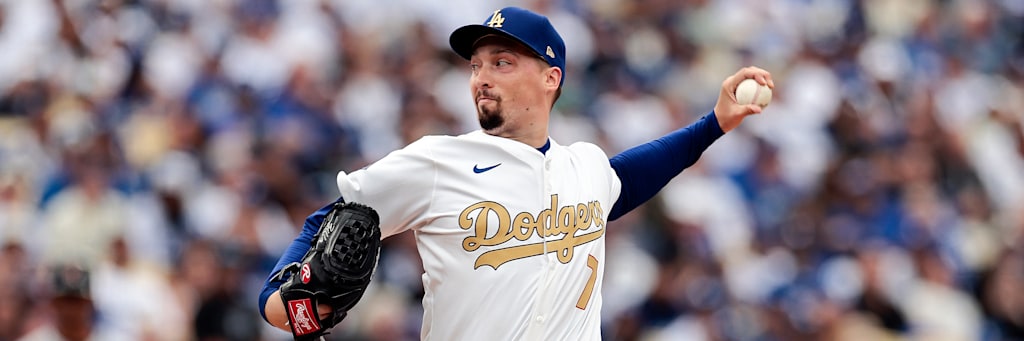
The moneyline on Dodgers at -171 is a run-prevention bet first. Robert Gasser projects 3.73 earned runs allowed across a 5.47-inning start plus relief; Blake Snell projects 2.68. The side that prevents more does not have to outslug anyone.
This is the largest stake on today's card. The other unders the same night load on the same run-environment factor; size the card as one bet, not seven independent shots. Full board: MLB picks today.
Milwaukee Brewers (2–0) at Los Angeles Dodgers (0–2), UNIQLO Field at Dodger Stadium, Los Angeles. Robert Gasser, a left-hander, is listed for the visitors. Blake Snell, a left-hander, is listed for the home club. Void the play if either listed starter is scratched.
| Side | Listed starter | Record | Park |
|---|---|---|---|
| Brewers | Robert Gasser | 2–0 | UNIQLO Field at Dodger Stadium |
| Dodgers | Blake Snell | 0–2 | Open, grass |
Rate statistics expressed per nine innings reward pitchers who work deep. Expressing them as a share of batters faced removes that distortion. Robert Gasser has faced 463 hitters. Blake Snell has faced 173.
| Starter | BF | K% | BB% | K−BB | K/BB | Pitches/BF |
|---|---|---|---|---|---|---|
| Robert Gasser | 463 | 22.2 | 7.6 | 14.7 | 2.94 | 3.92 |
| Blake Snell | 173 | 31.8 | 9.2 | 22.5 | 3.44 | 4.28 |
| Starter | W-L | ERA | IP | WHIP | K/9 | BB/9 | HR/9 | Opp AVG |
|---|---|---|---|---|---|---|---|---|
| Robert Gasser (L) | 5-5 | 3.87 | 109.1 | 1.19 | 8.48 | 2.88 | 1.23 | .229 |
| Blake Snell (L) | 4-1 | 1.90 | 42.2 | 1.10 | 11.60 | 3.38 | 0.00 | .203 |
Robert Gasser sits at a 3.87 ERA with a 1.19 WHIP and 35 walks in 109.1 innings. Blake Snell sits at a 1.90 ERA with a 1.10 WHIP and 16 walks in 42.2 innings. Walks stabilize faster than earned runs, so the walk column is the more trustworthy August reading.
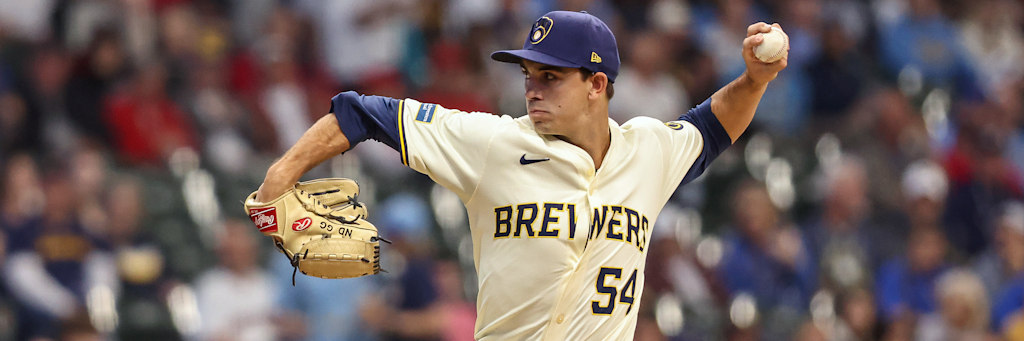
Season aggregates hide the last month. These are the prior starts, excluding today's outing so the table does not leak a result into a published prediction.
| Robert Gasser — last starts | IP | ER | K | BB | H | HR | Pitches |
|---|---|---|---|---|---|---|---|
| 2026-09-01 | 4.1 | 2 | 4 | 2 | 3 | — | 76 |
| 2026-09-07 | 4.2 | 1 | 5 | 2 | 3 | 1 | 83 |
| 2026-09-13 | 5.0 | 1 | 5 | 2 | 3 | — | 89 |
| 2026-09-19 | 7.0 | 0 | 2 | 3 | 3 | — | 107 |
| 2026-09-25 | 6.0 | 1 | 9 | 1 | 1 | 1 | 87 |
| Blake Snell — last starts | IP | ER | K | BB | H | HR | Pitches |
|---|---|---|---|---|---|---|---|
| 2026-08-29 | 5.0 | 1 | 10 | 3 | 3 | — | 99 |
| 2026-09-04 | 6.0 | 0 | 7 | 2 | 5 | — | 100 |
| 2026-09-11 | 5.2 | 1 | 8 | 2 | 4 | — | 101 |
| 2026-09-16 | 1.0 | 0 | 1 | — | 1 | — | 19 |
| 2026-09-26 | 4.0 | 1 | 3 | — | 5 | — | 77 |
Brewers have scored 832 runs in 162 games (5.14 per game) with a .744 OPS. Dodgers have scored 801 in 162 (4.94) with a .762 OPS. The pitching staffs have allowed 3.81 and 3.70 runs per game.
| Club | Record | R/G | OPS | Staff ERA | Staff WHIP | RA/G |
|---|---|---|---|---|---|---|
| Brewers | 2–0 | 5.14 | .744 | 3.51 | 1.18 | 3.81 |
| Dodgers | 0–2 | 4.94 | .762 | 3.55 | 1.14 | 3.70 |
Robert Gasser averages 5.47 innings per start. Blake Snell averages 4.74. Weight each starter's own earned run average across that length, then hand the remainder of the nine innings to his club's season staff rate. That is a conservative relief proxy — it mixes rotation and bullpen — and it is stated as a limitation, not hidden.
| Side | Starter IP | Starter ERA | Relief IP | Staff ERA | Projected ER |
|---|---|---|---|---|---|
| Brewers (Robert Gasser) | 5.47 | 3.87 | 3.53 | 3.51 | 3.73 |
| Dodgers (Blake Snell) | 4.74 | 1.90 | 4.26 | 3.55 | 2.68 |
| Combined | 6.41 |
A combined 6.41 projected earned runs. Unearned runs are ignored. Neither starter hits his average length every night. The opposing lineups are not in the formula; they sit in the table above.
UNIQLO Field at Dodger Stadium is listed at 330 feet to left, 385 feet to left center, 395 feet to center, 385 feet to right center, 330 feet to right, on grass, open at 515 feet above sea level with a listed capacity of 56,000. Park dimensions do not decide a total by themselves. They decide whether a walk plus a ball in the air becomes two runs or a long out.
Moneyline edges this thin die when the length assumption fails. If the better starter is out in the fourth, the staff rate takes over and the partition no longer applies.
A short outing from the starter on the backed side, or a crooked inning against the relief bucket that the partition treats as average, is the miss. The model is only as good as the length assumption of 5.47 and 4.74 innings.
Dodgers ML at -171, 3 units. A price of -171 implies a 63.1% break-even. Grade it against this published number. If a listed starter is scratched, the play is void.
Robert Gasser for Brewers. Blake Snell for Dodgers. Those names come from the MLB probable-pitcher feed, not from a guessed rotation.
Earned run average is a counting result. Strikeout and walk rates as a share of batters faced describe the process that produced it, and they stabilize on a smaller sample. Robert Gasser at 14.7 points of K−BB separation versus Blake Snell at 22.5 is the comparison ERA hides.
Against the published price, on the public record. Pending is not a win. Today's full card lives at a stable URL: mlb-picks.html.
Pick, odds, and unit size come from the BetLegend daily tracker. Probable starters, season rates, and venue facts are from the MLB Stats API. Educational analysis. 18+ only. 1-800-GAMBLER.
Parker Messick vs Freddy Peralta at Tropicana Field
Published October 13, 2026 · MLB Prediction Data Lab
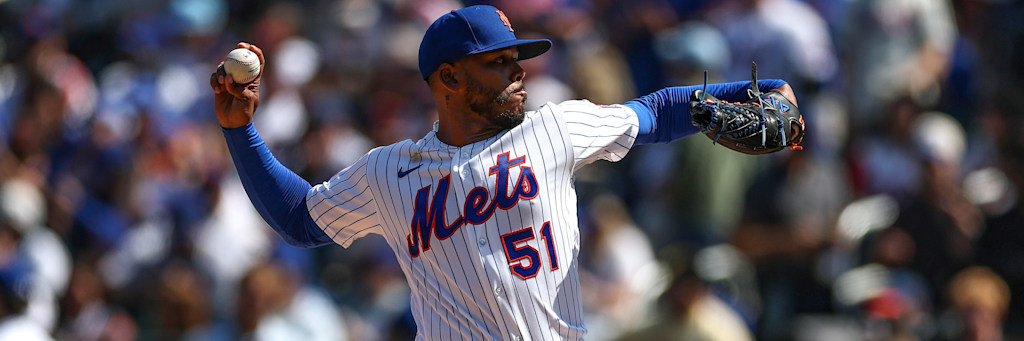
The posted total is 7.5. A naive add of season run rates (4.19 for Guardians, 4.54 for Rays) gets you 8.73 combined runs. That is not the bet. The bet is that Parker Messick and Freddy Peralta plus Tropicana Field pull the night below that baseline. Partitioning each starter's own earned-run rate across expected innings and handing the remainder to each club's season staff rate returns 7.11 projected earned runs.
This is the largest stake on today's card. The other unders the same night load on the same run-environment factor; size the card as one bet, not seven independent shots. Full board: MLB picks today.
Cleveland Guardians (1–0) at Tampa Bay Rays (0–1), Tropicana Field, St. Petersburg. Parker Messick, a left-hander, is listed for the visitors. Freddy Peralta, a right-hander, is listed for the home club. Void the play if either listed starter is scratched.
| Side | Listed starter | Record | Park |
|---|---|---|---|
| Guardians | Parker Messick | 1–0 | Tropicana Field |
| Rays | Freddy Peralta | 0–1 | Dome, artificial turf |
Rate statistics expressed per nine innings reward pitchers who work deep. Expressing them as a share of batters faced removes that distortion. Parker Messick has faced 747 hitters. Freddy Peralta has faced 730.
| Starter | BF | K% | BB% | K−BB | K/BB | Pitches/BF |
|---|---|---|---|---|---|---|
| Parker Messick | 747 | 25.8 | 6.6 | 19.3 | 3.94 | 3.95 |
| Freddy Peralta | 730 | 21.4 | 8.6 | 12.7 | 2.48 | 4.05 |
| Starter | W-L | ERA | IP | WHIP | K/9 | BB/9 | HR/9 | Opp AVG |
|---|---|---|---|---|---|---|---|---|
| Parker Messick (L) | 12-9 | 2.56 | 186.1 | 1.06 | 9.32 | 2.37 | 0.82 | .217 |
| Freddy Peralta (R) | 10-11 | 4.42 | 169.0 | 1.33 | 8.31 | 3.36 | 1.22 | .247 |
Parker Messick sits at a 2.56 ERA with a 1.06 WHIP and 49 walks in 186.1 innings. Freddy Peralta sits at a 4.42 ERA with a 1.33 WHIP and 63 walks in 169.0 innings. Walks stabilize faster than earned runs, so the walk column is the more trustworthy August reading.
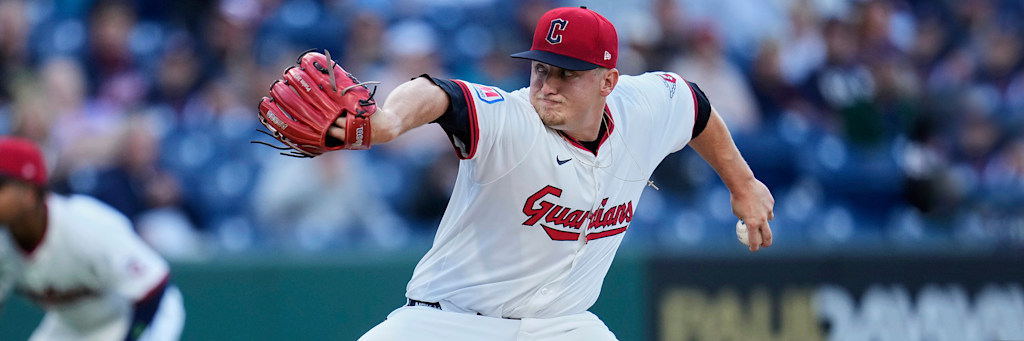
Season aggregates hide the last month. These are the prior starts, excluding today's outing so the table does not leak a result into a published prediction.
| Parker Messick — last starts | IP | ER | K | BB | H | HR | Pitches |
|---|---|---|---|---|---|---|---|
| 2026-09-05 | 6.0 | 3 | 12 | 2 | 7 | 2 | 103 |
| 2026-09-11 | 5.1 | 1 | 5 | 2 | 3 | — | 95 |
| 2026-09-16 | 6.0 | 3 | 8 | — | 7 | 1 | 86 |
| 2026-09-22 | 5.0 | 1 | 5 | 1 | 5 | — | 96 |
| 2026-09-27 | 3.0 | 1 | 2 | 1 | 6 | — | 64 |
| Freddy Peralta — last starts | IP | ER | K | BB | H | HR | Pitches |
|---|---|---|---|---|---|---|---|
| 2026-09-01 | 6.0 | 1 | 7 | — | 3 | 1 | 74 |
| 2026-09-08 | 6.0 | 1 | 2 | 1 | 5 | — | 92 |
| 2026-09-13 | 5.0 | 0 | 4 | 3 | — | — | 86 |
| 2026-09-19 | 5.2 | 1 | 6 | 2 | 4 | — | 97 |
| 2026-09-25 | 5.1 | 0 | 4 | 3 | 4 | — | 93 |
Guardians have scored 678 runs in 162 games (4.19 per game) with a .696 OPS. Rays have scored 736 in 162 (4.54) with a .728 OPS. The pitching staffs have allowed 4.12 and 4.01 runs per game.
| Club | Record | R/G | OPS | Staff ERA | Staff WHIP | RA/G |
|---|---|---|---|---|---|---|
| Guardians | 1–0 | 4.19 | .696 | 3.77 | 1.26 | 4.12 |
| Rays | 0–1 | 4.54 | .728 | 3.70 | 1.14 | 4.01 |
Parker Messick averages 5.82 innings per start. Freddy Peralta averages 5.28. Weight each starter's own earned run average across that length, then hand the remainder of the nine innings to his club's season staff rate. That is a conservative relief proxy — it mixes rotation and bullpen — and it is stated as a limitation, not hidden.
| Side | Starter IP | Starter ERA | Relief IP | Staff ERA | Projected ER |
|---|---|---|---|---|---|
| Guardians (Parker Messick) | 5.82 | 2.56 | 3.18 | 3.77 | 2.99 |
| Rays (Freddy Peralta) | 5.28 | 4.42 | 3.72 | 3.70 | 4.12 |
| Combined | 7.11 |
A combined 7.11 projected earned runs against a 7.5 total. Unearned runs are ignored. Neither starter hits his average length every night. The opposing lineups are not in the formula; they sit in the table above.
Tropicana Field is listed at 315 feet to left, 410 feet to left center, 404 feet to center, 404 feet to right center, 322 feet to right, on artificial turf, dome at 15 feet above sea level with a listed capacity of 25,025. Park dimensions do not decide a total by themselves. They decide whether a walk plus a ball in the air becomes two runs or a long out.
The season run rates do not want this number. Combined they sit at 8.73 against a 7.5 total, a gap of 1.23 runs that the starters and the park have to close. Freddy Peralta also allows 1.22 home runs per nine, and one three-run ball turns a low-event night into a push or a loss.
A start from either pitcher that ends before the fifth with a pitch count above 95, or a walk total of four-plus from Freddy Peralta, is the cleanest failure signal. That is how a 7.5 total gets away: free baserunners, an early bullpen, and a second time through a lineup that already scores 4.54 runs a night on the higher side.
Guardians/Rays Under 7.5 at -164, 2.5 units. A price of -164 implies a 62.1% break-even. Grade it against this published number. If a listed starter is scratched, the play is void.
Parker Messick for Guardians. Freddy Peralta for Rays. Those names come from the MLB probable-pitcher feed, not from a guessed rotation.
Earned run average is a counting result. Strikeout and walk rates as a share of batters faced describe the process that produced it, and they stabilize on a smaller sample. Parker Messick at 19.3 points of K−BB separation versus Freddy Peralta at 12.7 is the comparison ERA hides.
Against the published price, on the public record. Pending is not a win. Today's full card lives at a stable URL: mlb-picks.html.
Pick, odds, and unit size come from the BetLegend daily tracker. Probable starters, season rates, and venue facts are from the MLB Stats API. Educational analysis. 18+ only. 1-800-GAMBLER.
Parker Messick vs Hagen Smith at Rate Field
Published October 8, 2026 · MLB Prediction Data Lab
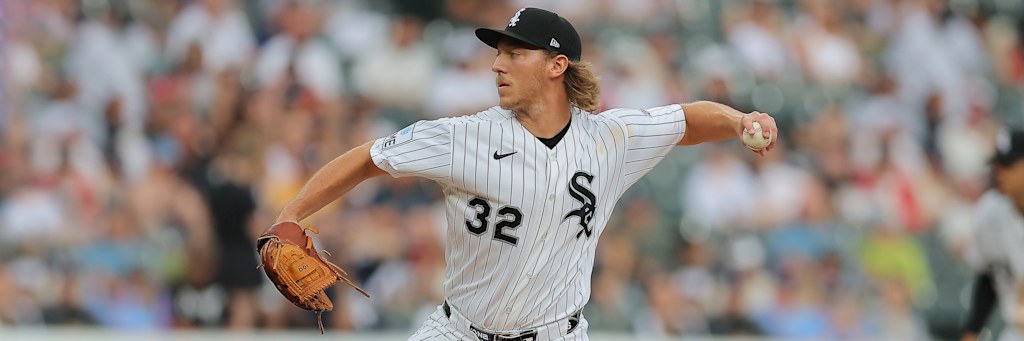
A team total of 4.5 is a one-side problem. The model is asking whether Parker Messick can hold White Sox under that number for nine innings, with the park and the opposing staff rate doing the rest of the work.
This is the largest stake on today's card. The other unders the same night load on the same run-environment factor; size the card as one bet, not seven independent shots. Full board: MLB picks today.
Cleveland Guardians (1–2) at Chicago White Sox (2–1), Rate Field, Chicago. Parker Messick, a left-hander, is listed for the visitors. Hagen Smith, a left-hander, is listed for the home club. Void the play if either listed starter is scratched. First-pitch weather listed 64°F, Clear, wind 3 mph, In From CF.
| Side | Listed starter | Record | Park |
|---|---|---|---|
| Guardians | Parker Messick | 1–2 | Rate Field |
| White Sox | Hagen Smith | 2–1 | Open, grass |
Rate statistics expressed per nine innings reward pitchers who work deep. Expressing them as a share of batters faced removes that distortion. Parker Messick has faced 747 hitters. Hagen Smith has faced 110.
| Starter | BF | K% | BB% | K−BB | K/BB | Pitches/BF |
|---|---|---|---|---|---|---|
| Parker Messick | 747 | 25.8 | 6.6 | 19.3 | 3.94 | 3.95 |
| Hagen Smith | 110 | 37.3 | 14.5 | 22.7 | 2.56 | 4.26 |
| Starter | W-L | ERA | IP | WHIP | K/9 | BB/9 | HR/9 | Opp AVG |
|---|---|---|---|---|---|---|---|---|
| Parker Messick (L) | 12-9 | 2.56 | 186.1 | 1.06 | 9.32 | 2.37 | 0.82 | .217 |
| Hagen Smith (L) | 3-3 | 1.29 | 28.0 | 0.96 | 13.18 | 5.14 | 0.32 | .117 |
Parker Messick sits at a 2.56 ERA with a 1.06 WHIP and 49 walks in 186.1 innings. Hagen Smith sits at a 1.29 ERA with a 0.96 WHIP and 16 walks in 28.0 innings. Walks stabilize faster than earned runs, so the walk column is the more trustworthy August reading.
Season aggregates hide the last month. These are the prior starts, excluding today's outing so the table does not leak a result into a published prediction.
| Parker Messick — last starts | IP | ER | K | BB | H | HR | Pitches |
|---|---|---|---|---|---|---|---|
| 2026-09-05 | 6.0 | 3 | 12 | 2 | 7 | 2 | 103 |
| 2026-09-11 | 5.1 | 1 | 5 | 2 | 3 | — | 95 |
| 2026-09-16 | 6.0 | 3 | 8 | — | 7 | 1 | 86 |
| 2026-09-22 | 5.0 | 1 | 5 | 1 | 5 | — | 96 |
| 2026-09-27 | 3.0 | 1 | 2 | 1 | 6 | — | 64 |
| Hagen Smith — last starts | IP | ER | K | BB | H | HR | Pitches |
|---|---|---|---|---|---|---|---|
| 2026-09-16 | 1.2 | 2 | 2 | 2 | 1 | — | 30 |
| 2026-09-18 | 1.0 | 0 | 3 | 1 | — | — | 20 |
| 2026-09-20 | 0.2 | 0 | 1 | 2 | — | — | 18 |
| 2026-09-23 | 2.0 | 1 | 2 | — | 2 | — | 33 |
| 2026-09-25 | 0.2 | 0 | 1 | 1 | — | — | 18 |
Guardians have scored 678 runs in 162 games (4.19 per game) with a .696 OPS. White Sox have scored 776 in 162 (4.79) with a .726 OPS. The pitching staffs have allowed 4.12 and 4.44 runs per game.
| Club | Record | R/G | OPS | Staff ERA | Staff WHIP | RA/G |
|---|---|---|---|---|---|---|
| Guardians | 1–2 | 4.19 | .696 | 3.77 | 1.26 | 4.12 |
| White Sox | 2–1 | 4.79 | .726 | 4.12 | 1.31 | 4.44 |
Parker Messick averages 5.82 innings per start. Hagen Smith averages 28.00. Weight each starter's own earned run average across that length, then hand the remainder of the nine innings to his club's season staff rate. That is a conservative relief proxy — it mixes rotation and bullpen — and it is stated as a limitation, not hidden.
| Side | Starter IP | Starter ERA | Relief IP | Staff ERA | Projected ER |
|---|---|---|---|---|---|
| Guardians (Parker Messick) | 5.82 | 2.56 | 3.18 | 3.77 | 2.99 |
| White Sox (Hagen Smith) | 28.00 | 1.29 | 0.00 | 4.12 | 4.01 |
| Combined | 7.00 |
A combined 7.00 projected earned runs against a 4.5 total. Unearned runs are ignored. Neither starter hits his average length every night. The opposing lineups are not in the formula; they sit in the table above.
Rate Field is listed at 330 feet to left, 377 feet to left center, 400 feet to center, 372 feet to right center, 335 feet to right, on grass, open at 595 feet above sea level with a listed capacity of 40,126. Park dimensions do not decide a total by themselves. They decide whether a walk plus a ball in the air becomes two runs or a long out.
Team totals this tight have no cushion. A single homer plus a walk and a double is the whole bet.
An early exit from the opposing starter, or a three-run inning before the fifth, breaks a 4.5 team total. The number is small enough that one cluster inning does it.
White Sox Team Total Under 4.5 at -235, 1 units. A price of -235 implies a 70.1% break-even. Grade it against this published number. If a listed starter is scratched, the play is void.
Parker Messick for Guardians. Hagen Smith for White Sox. Those names come from the MLB probable-pitcher feed, not from a guessed rotation.
Earned run average is a counting result. Strikeout and walk rates as a share of batters faced describe the process that produced it, and they stabilize on a smaller sample. Parker Messick at 19.3 points of K−BB separation versus Hagen Smith at 22.7 is the comparison ERA hides.
Against the published price, on the public record. Pending is not a win. Today's full card lives at a stable URL: mlb-picks.html.
Pick, odds, and unit size come from the BetLegend daily tracker. Probable starters, season rates, and venue facts are from the MLB Stats API. Educational analysis. 18+ only. 1-800-GAMBLER.
Daniel Espino vs Sean Newcomb at Rate Field
Published October 7, 2026 · MLB Prediction Data Lab
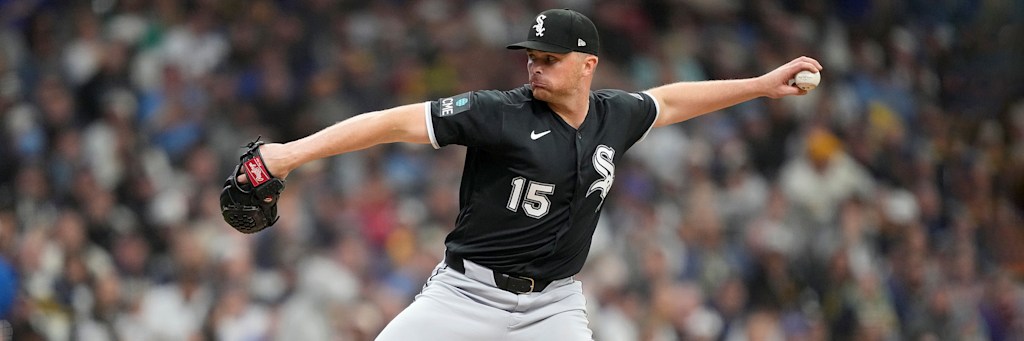
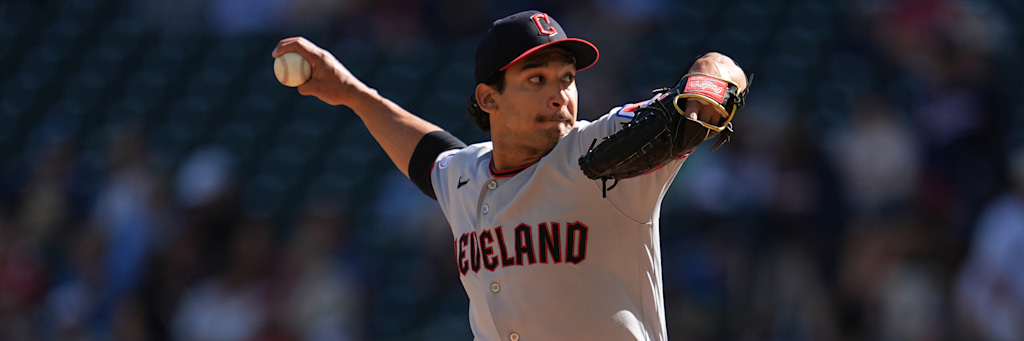
The moneyline on White Sox at -130 is a run-prevention bet first. Daniel Espino projects 3.96 earned runs allowed across a 5.11-inning start plus relief; Sean Newcomb projects 5.17. The side that prevents more does not have to outslug anyone.
Full slate: MLB picks today, October 7, 2026.
Cleveland Guardians (0–2) at Chicago White Sox (2–0), Rate Field, Chicago. Daniel Espino, a right-hander, is listed for the visitors. Sean Newcomb, a left-hander, is listed for the home club. Void the play if either listed starter is scratched. First-pitch weather listed 75°F, Sunny, wind 8 mph, L To R.
| Side | Listed starter | Record | Park |
|---|---|---|---|
| Guardians | Daniel Espino | 0–2 | Rate Field |
| White Sox | Sean Newcomb | 2–0 | Open, grass |
Rate statistics expressed per nine innings reward pitchers who work deep. Expressing them as a share of batters faced removes that distortion. Daniel Espino has faced 65 hitters. Sean Newcomb has faced 372.
| Starter | BF | K% | BB% | K−BB | K/BB | Pitches/BF |
|---|---|---|---|---|---|---|
| Daniel Espino | 65 | 38.5 | 10.8 | 27.7 | 3.57 | 4.20 |
| Sean Newcomb | 372 | 22.6 | 9.1 | 13.4 | 2.47 | 3.96 |
| Starter | W-L | ERA | IP | WHIP | K/9 | BB/9 | HR/9 | Opp AVG |
|---|---|---|---|---|---|---|---|---|
| Daniel Espino (R) | —-— | 4.11 | 15.1 | 1.24 | 14.67 | 4.11 | 1.76 | .207 |
| Sean Newcomb (L) | 2-5 | 3.09 | 90.1 | 1.18 | 8.37 | 3.39 | 0.40 | .223 |
Daniel Espino sits at a 4.11 ERA with a 1.24 WHIP and 7 walks in 15.1 innings. Sean Newcomb sits at a 3.09 ERA with a 1.18 WHIP and 34 walks in 90.1 innings. Walks stabilize faster than earned runs, so the walk column is the more trustworthy August reading.
Season aggregates hide the last month. These are the prior starts, excluding today's outing so the table does not leak a result into a published prediction.
| Daniel Espino — last starts | IP | ER | K | BB | H | HR | Pitches |
|---|---|---|---|---|---|---|---|
| 2026-09-12 | 2.0 | 0 | 2 | — | 1 | — | 26 |
| 2026-09-14 | 0.1 | 1 | 1 | — | 1 | 1 | 12 |
| 2026-09-18 | 1.0 | 3 | 1 | 3 | 1 | 1 | 27 |
| 2026-09-24 | 1.0 | 0 | 2 | — | — | — | 17 |
| 2026-09-25 | 1.0 | 0 | 1 | — | — | — | 13 |
| Sean Newcomb — last starts | IP | ER | K | BB | H | HR | Pitches |
|---|---|---|---|---|---|---|---|
| 2026-09-16 | 0.0 | 2 | — | 2 | 2 | 1 | 20 |
| 2026-09-18 | 0.2 | 3 | — | 1 | 2 | 1 | 24 |
| 2026-09-23 | 2.0 | 0 | 2 | — | 1 | — | 25 |
| 2026-09-26 | 1.2 | 0 | 2 | — | 1 | — | 22 |
| 2026-09-27 | 0.2 | 0 | 2 | 1 | — | — | 17 |
Guardians have scored 678 runs in 162 games (4.19 per game) with a .696 OPS. White Sox have scored 776 in 162 (4.79) with a .726 OPS. The pitching staffs have allowed 4.12 and 4.44 runs per game.
| Club | Record | R/G | OPS | Staff ERA | Staff WHIP | RA/G |
|---|---|---|---|---|---|---|
| Guardians | 0–2 | 4.19 | .696 | 3.77 | 1.26 | 4.12 |
| White Sox | 2–0 | 4.79 | .726 | 4.12 | 1.31 | 4.44 |
Daniel Espino averages 5.11 innings per start. Sean Newcomb averages 15.06. Weight each starter's own earned run average across that length, then hand the remainder of the nine innings to his club's season staff rate. That is a conservative relief proxy — it mixes rotation and bullpen — and it is stated as a limitation, not hidden.
| Side | Starter IP | Starter ERA | Relief IP | Staff ERA | Projected ER |
|---|---|---|---|---|---|
| Guardians (Daniel Espino) | 5.11 | 4.11 | 3.89 | 3.77 | 3.96 |
| White Sox (Sean Newcomb) | 15.06 | 3.09 | 0.00 | 4.12 | 5.17 |
| Combined | 9.13 |
A combined 9.13 projected earned runs. Unearned runs are ignored. Neither starter hits his average length every night. The opposing lineups are not in the formula; they sit in the table above.
Rate Field is listed at 330 feet to left, 377 feet to left center, 400 feet to center, 372 feet to right center, 335 feet to right, on grass, open at 595 feet above sea level with a listed capacity of 40,126. Park dimensions do not decide a total by themselves. They decide whether a walk plus a ball in the air becomes two runs or a long out.
Moneyline edges this thin die when the length assumption fails. If the better starter is out in the fourth, the staff rate takes over and the partition no longer applies.
A short outing from the starter on the backed side, or a crooked inning against the relief bucket that the partition treats as average, is the miss. The model is only as good as the length assumption of 5.11 and 15.06 innings.
White Sox ML at -130, 1 units. A price of -130 implies a 56.5% break-even. Grade it against this published number. If a listed starter is scratched, the play is void.
Daniel Espino for Guardians. Sean Newcomb for White Sox. Those names come from the MLB probable-pitcher feed, not from a guessed rotation.
Earned run average is a counting result. Strikeout and walk rates as a share of batters faced describe the process that produced it, and they stabilize on a smaller sample. Daniel Espino at 27.7 points of K−BB separation versus Sean Newcomb at 13.4 is the comparison ERA hides.
Against the published price, on the public record. Pending is not a win. Today's full card lives at a stable URL: mlb-picks.html.
Pick, odds, and unit size come from the BetLegend daily tracker. Probable starters, season rates, and venue facts are from the MLB Stats API. Educational analysis. 18+ only. 1-800-GAMBLER.
Tyler Glasnow vs Tyler Mahle at Truist Park
Published October 7, 2026 · MLB Prediction Data Lab
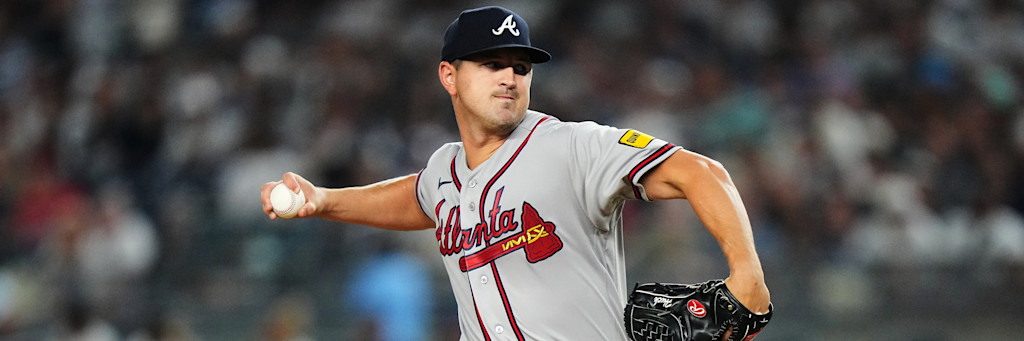
The posted total is 8.0. A naive add of season run rates (4.94 for Dodgers, 4.58 for Braves) gets you 9.52 combined runs. That is not the bet. The bet is that Tyler Glasnow and Tyler Mahle plus Truist Park pull the night below that baseline. Partitioning each starter's own earned-run rate across expected innings and handing the remainder to each club's season staff rate returns 7.39 projected earned runs.
This is the largest stake on today's card. The other unders the same night load on the same run-environment factor; size the card as one bet, not seven independent shots. Full board: MLB picks today.
Los Angeles Dodgers (2–1) at Atlanta Braves (1–2), Truist Park, Atlanta. Tyler Glasnow, a right-hander, is listed for the visitors. Tyler Mahle, a right-hander, is listed for the home club. Void the play if either listed starter is scratched.
| Side | Listed starter | Record | Park |
|---|---|---|---|
| Dodgers | Tyler Glasnow | 2–1 | Truist Park |
| Braves | Tyler Mahle | 1–2 | Open, grass |
Rate statistics expressed per nine innings reward pitchers who work deep. Expressing them as a share of batters faced removes that distortion. Tyler Glasnow has faced 288 hitters. Tyler Mahle has faced 614.
| Starter | BF | K% | BB% | K−BB | K/BB | Pitches/BF |
|---|---|---|---|---|---|---|
| Tyler Glasnow | 288 | 34.0 | 8.7 | 25.3 | 3.92 | 3.99 |
| Tyler Mahle | 614 | 22.3 | 7.5 | 14.8 | 2.98 | 3.91 |
| Starter | W-L | ERA | IP | WHIP | K/9 | BB/9 | HR/9 | Opp AVG |
|---|---|---|---|---|---|---|---|---|
| Tyler Glasnow (R) | 5-2 | 3.53 | 74.0 | 0.95 | 11.92 | 3.04 | 0.85 | .175 |
| Tyler Mahle (R) | 7-10 | 3.99 | 149.0 | 1.23 | 8.28 | 2.78 | 1.21 | .248 |
Tyler Glasnow sits at a 3.53 ERA with a 0.95 WHIP and 25 walks in 74.0 innings. Tyler Mahle sits at a 3.99 ERA with a 1.23 WHIP and 46 walks in 149.0 innings. Walks stabilize faster than earned runs, so the walk column is the more trustworthy August reading.
Season aggregates hide the last month. These are the prior starts, excluding today's outing so the table does not leak a result into a published prediction.
| Tyler Glasnow — last starts | IP | ER | K | BB | H | HR | Pitches |
|---|---|---|---|---|---|---|---|
| 2026-08-30 | 7.0 | 1 | 6 | 1 | 2 | — | 85 |
| 2026-09-05 | 6.0 | 4 | 8 | 3 | 6 | — | 96 |
| 2026-09-12 | 4.0 | 4 | 7 | 4 | 5 | 1 | 91 |
| 2026-09-18 | 6.0 | 2 | 10 | 2 | 3 | 1 | 98 |
| 2026-09-24 | 6.1 | 3 | 11 | 2 | 3 | — | 91 |
| Tyler Mahle — last starts | IP | ER | K | BB | H | HR | Pitches |
|---|---|---|---|---|---|---|---|
| 2026-08-30 | 6.2 | 1 | 9 | — | 5 | 1 | 89 |
| 2026-09-06 | 6.0 | 0 | 3 | 1 | 4 | — | 94 |
| 2026-09-12 | 7.0 | 1 | 3 | — | 6 | 1 | 97 |
| 2026-09-18 | 6.0 | 1 | 6 | 1 | 3 | — | 98 |
| 2026-09-24 | 5.0 | 5 | 4 | 2 | 6 | 2 | 91 |
Dodgers have scored 801 runs in 162 games (4.94 per game) with a .762 OPS. Braves have scored 742 in 162 (4.58) with a .718 OPS. The pitching staffs have allowed 3.70 and 3.86 runs per game.
| Club | Record | R/G | OPS | Staff ERA | Staff WHIP | RA/G |
|---|---|---|---|---|---|---|
| Dodgers | 2–1 | 4.94 | .762 | 3.55 | 1.14 | 3.70 |
| Braves | 1–2 | 4.58 | .718 | 3.63 | 1.24 | 3.86 |
Tyler Glasnow averages 5.69 innings per start. Tyler Mahle averages 5.52. Weight each starter's own earned run average across that length, then hand the remainder of the nine innings to his club's season staff rate. That is a conservative relief proxy — it mixes rotation and bullpen — and it is stated as a limitation, not hidden.
| Side | Starter IP | Starter ERA | Relief IP | Staff ERA | Projected ER |
|---|---|---|---|---|---|
| Dodgers (Tyler Glasnow) | 5.69 | 3.53 | 3.31 | 3.55 | 3.54 |
| Braves (Tyler Mahle) | 5.52 | 3.99 | 3.48 | 3.63 | 3.85 |
| Combined | 7.39 |
A combined 7.39 projected earned runs against a 8.0 total. Unearned runs are ignored. Neither starter hits his average length every night. The opposing lineups are not in the formula; they sit in the table above.
Truist Park is listed at 335 feet to left, 385 feet to left center, 400 feet to center, 375 feet to right center, 325 feet to right, on grass, open at 1001 feet above sea level with a listed capacity of 40,819. Park dimensions do not decide a total by themselves. They decide whether a walk plus a ball in the air becomes two runs or a long out.
The season run rates do not want this number. Combined they sit at 9.52 against a 8.0 total, a gap of 1.52 runs that the starters and the park have to close. Tyler Mahle also allows 1.21 home runs per nine, and one three-run ball turns a low-event night into a push or a loss.
A start from either pitcher that ends before the fifth with a pitch count above 95, or a walk total of four-plus from Tyler Glasnow, is the cleanest failure signal. That is how a 8.0 total gets away: free baserunners, an early bullpen, and a second time through a lineup that already scores 4.94 runs a night on the higher side.
Dodgers/Braves Under 8 at -130, 2.5 units. A price of -130 implies a 56.5% break-even. Grade it against this published number. If a listed starter is scratched, the play is void.
Tyler Glasnow for Dodgers. Tyler Mahle for Braves. Those names come from the MLB probable-pitcher feed, not from a guessed rotation.
Earned run average is a counting result. Strikeout and walk rates as a share of batters faced describe the process that produced it, and they stabilize on a smaller sample. Tyler Glasnow at 25.3 points of K−BB separation versus Tyler Mahle at 14.8 is the comparison ERA hides.
Against the published price, on the public record. Pending is not a win. Today's full card lives at a stable URL: mlb-picks.html.
Pick, odds, and unit size come from the BetLegend daily tracker. Probable starters, season rates, and venue facts are from the MLB Stats API. Educational analysis. 18+ only. 1-800-GAMBLER.
Nick Martinez vs Max Fried at Yankee Stadium
Published October 7, 2026 · MLB Prediction Data Lab
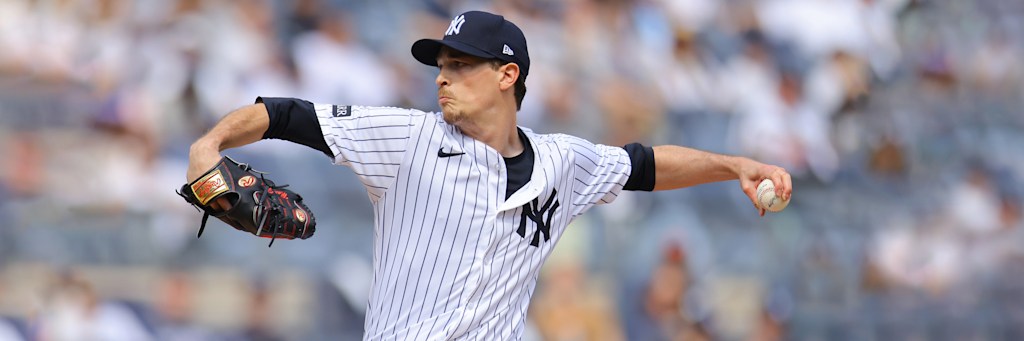
The moneyline on Yankees at -168 is a run-prevention bet first. Nick Martinez projects 3.31 earned runs allowed across a 5.81-inning start plus relief; Max Fried projects 2.96. The side that prevents more does not have to outslug anyone.
Full slate: MLB picks today, October 7, 2026.
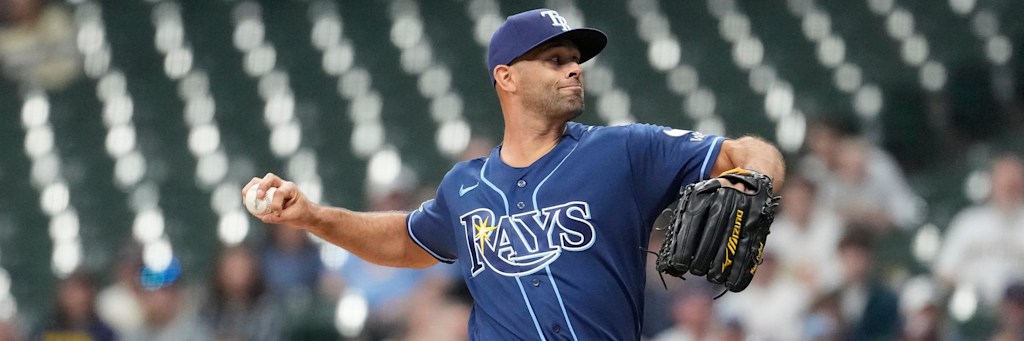
Tampa Bay Rays (2–0) at New York Yankees (0–2), Yankee Stadium, Bronx. Nick Martinez, a right-hander, is listed for the visitors. Max Fried, a left-hander, is listed for the home club. Void the play if either listed starter is scratched.
| Side | Listed starter | Record | Park |
|---|---|---|---|
| Rays | Nick Martinez | 2–0 | Yankee Stadium |
| Yankees | Max Fried | 0–2 | Open, grass |
Rate statistics expressed per nine innings reward pitchers who work deep. Expressing them as a share of batters faced removes that distortion. Nick Martinez has faced 722 hitters. Max Fried has faced 434.
| Starter | BF | K% | BB% | K−BB | K/BB | Pitches/BF |
|---|---|---|---|---|---|---|
| Nick Martinez | 722 | 15.1 | 3.6 | 11.5 | 4.19 | 3.50 |
| Max Fried | 434 | 24.0 | 7.6 | 16.4 | 3.15 | 3.91 |
| Starter | W-L | ERA | IP | WHIP | K/9 | BB/9 | HR/9 | Opp AVG |
|---|---|---|---|---|---|---|---|---|
| Nick Martinez (R) | 15-6 | 3.10 | 180.0 | 1.09 | 5.45 | 1.30 | 1.10 | .249 |
| Max Fried (L) | 5-5 | 2.80 | 112.2 | 0.99 | 8.31 | 2.64 | 0.32 | .201 |
Nick Martinez sits at a 3.10 ERA with a 1.09 WHIP and 26 walks in 180.0 innings. Max Fried sits at a 2.80 ERA with a 0.99 WHIP and 33 walks in 112.2 innings. Walks stabilize faster than earned runs, so the walk column is the more trustworthy August reading.
Season aggregates hide the last month. These are the prior starts, excluding today's outing so the table does not leak a result into a published prediction.
| Nick Martinez — last starts | IP | ER | K | BB | H | HR | Pitches |
|---|---|---|---|---|---|---|---|
| 2026-09-04 | 6.1 | 3 | 4 | 2 | 5 | 1 | 90 |
| 2026-09-10 | 6.1 | 0 | 3 | — | 2 | — | 68 |
| 2026-09-16 | 5.0 | 2 | 3 | — | 5 | 2 | 72 |
| 2026-09-22 | 6.0 | 2 | 7 | 1 | 5 | 1 | 94 |
| 2026-09-27 | 2.2 | 4 | 1 | 1 | 7 | — | 50 |
| Max Fried — last starts | IP | ER | K | BB | H | HR | Pitches |
|---|---|---|---|---|---|---|---|
| 2026-08-29 | 3.2 | 1 | 4 | 1 | 3 | 1 | 63 |
| 2026-09-04 | 5.2 | 1 | 4 | 1 | 4 | — | 72 |
| 2026-09-10 | 3.1 | 1 | 7 | 2 | 1 | 1 | 80 |
| 2026-09-15 | 7.0 | 1 | 6 | — | 6 | — | 88 |
| 2026-09-22 | 6.2 | 4 | 4 | 2 | 6 | — | 97 |
Rays have scored 736 runs in 162 games (4.54 per game) with a .728 OPS. Yankees have scored 739 in 161 (4.59) with a .720 OPS. The pitching staffs have allowed 4.01 and 3.73 runs per game.
| Club | Record | R/G | OPS | Staff ERA | Staff WHIP | RA/G |
|---|---|---|---|---|---|---|
| Rays | 2–0 | 4.54 | .728 | 3.70 | 1.14 | 4.01 |
| Yankees | 0–2 | 4.59 | .720 | 3.23 | 1.17 | 3.73 |
Nick Martinez averages 5.81 innings per start. Max Fried averages 5.63. Weight each starter's own earned run average across that length, then hand the remainder of the nine innings to his club's season staff rate. That is a conservative relief proxy — it mixes rotation and bullpen — and it is stated as a limitation, not hidden.
| Side | Starter IP | Starter ERA | Relief IP | Staff ERA | Projected ER |
|---|---|---|---|---|---|
| Rays (Nick Martinez) | 5.81 | 3.10 | 3.19 | 3.70 | 3.31 |
| Yankees (Max Fried) | 5.63 | 2.80 | 3.37 | 3.23 | 2.96 |
| Combined | 6.27 |
A combined 6.27 projected earned runs. Unearned runs are ignored. Neither starter hits his average length every night. The opposing lineups are not in the formula; they sit in the table above.
Yankee Stadium is listed at 318 feet to left, 399 feet to left center, 408 feet to center, 385 feet to right center, 314 feet to right, on grass, open at 55 feet above sea level with a listed capacity of 46,537. Park dimensions do not decide a total by themselves. They decide whether a walk plus a ball in the air becomes two runs or a long out.
Moneyline edges this thin die when the length assumption fails. If the better starter is out in the fourth, the staff rate takes over and the partition no longer applies.
A short outing from the starter on the backed side, or a crooked inning against the relief bucket that the partition treats as average, is the miss. The model is only as good as the length assumption of 5.81 and 5.63 innings.
Yankees ML at -168, 2 units. A price of -168 implies a 62.7% break-even. Grade it against this published number. If a listed starter is scratched, the play is void.
Nick Martinez for Rays. Max Fried for Yankees. Those names come from the MLB probable-pitcher feed, not from a guessed rotation.
Earned run average is a counting result. Strikeout and walk rates as a share of batters faced describe the process that produced it, and they stabilize on a smaller sample. Nick Martinez at 11.5 points of K−BB separation versus Max Fried at 16.4 is the comparison ERA hides.
Against the published price, on the public record. Pending is not a win. Today's full card lives at a stable URL: mlb-picks.html.
Pick, odds, and unit size come from the BetLegend daily tracker. Probable starters, season rates, and venue facts are from the MLB Stats API. Educational analysis. 18+ only. 1-800-GAMBLER.
Yoshinobu Yamamoto vs Chris Sale at Truist Park
Published October 6, 2026 · MLB Prediction Data Lab
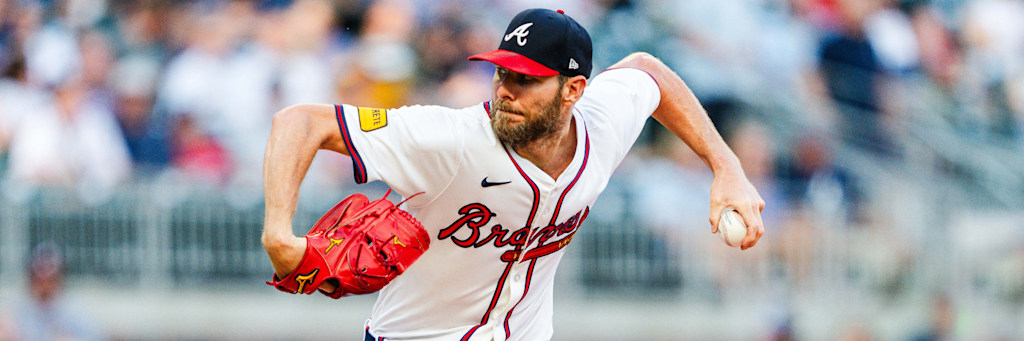
The posted total is 7.0. A naive add of season run rates (4.94 for Dodgers, 4.58 for Braves) gets you 9.52 combined runs. That is not the bet. The bet is that Yoshinobu Yamamoto and Chris Sale plus Truist Park pull the night below that baseline. Partitioning each starter's own earned-run rate across expected innings and handing the remainder to each club's season staff rate returns 5.45 projected earned runs.
This is the largest stake on today's card. The other unders the same night load on the same run-environment factor; size the card as one bet, not seven independent shots. Full board: MLB picks today.
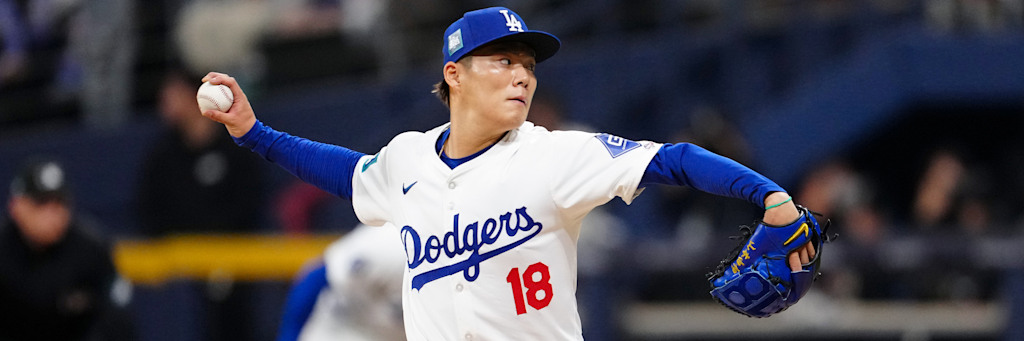
Los Angeles Dodgers (1–1) at Atlanta Braves (1–1), Truist Park, Atlanta. Yoshinobu Yamamoto, a right-hander, is listed for the visitors. Chris Sale, a left-hander, is listed for the home club. Void the play if either listed starter is scratched.
| Side | Listed starter | Record | Park |
|---|---|---|---|
| Dodgers | Yoshinobu Yamamoto | 1–1 | Truist Park |
| Braves | Chris Sale | 1–1 | Open, grass |
Rate statistics expressed per nine innings reward pitchers who work deep. Expressing them as a share of batters faced removes that distortion. Yoshinobu Yamamoto has faced 708 hitters. Chris Sale has faced 648.
| Starter | BF | K% | BB% | K−BB | K/BB | Pitches/BF |
|---|---|---|---|---|---|---|
| Yoshinobu Yamamoto | 708 | 25.7 | 5.9 | 19.8 | 4.33 | 3.86 |
| Chris Sale | 648 | 30.9 | 4.8 | 26.1 | 6.45 | 3.97 |
| Starter | W-L | ERA | IP | WHIP | K/9 | BB/9 | HR/9 | Opp AVG |
|---|---|---|---|---|---|---|---|---|
| Yoshinobu Yamamoto (R) | 14-9 | 2.53 | 185.0 | 0.87 | 8.85 | 2.04 | 0.97 | .182 |
| Chris Sale (L) | 14-9 | 2.16 | 162.2 | 0.98 | 11.07 | 1.72 | 0.55 | .215 |
Yoshinobu Yamamoto sits at a 2.53 ERA with a 0.87 WHIP and 42 walks in 185.0 innings. Chris Sale sits at a 2.16 ERA with a 0.98 WHIP and 31 walks in 162.2 innings. Walks stabilize faster than earned runs, so the walk column is the more trustworthy August reading.
Season aggregates hide the last month. These are the prior starts, excluding today's outing so the table does not leak a result into a published prediction.
| Yoshinobu Yamamoto — last starts | IP | ER | K | BB | H | HR | Pitches |
|---|---|---|---|---|---|---|---|
| 2026-08-27 | 6.1 | 1 | 8 | 1 | 4 | 1 | 105 |
| 2026-09-02 | 7.0 | 4 | 8 | 2 | 5 | 2 | 93 |
| 2026-09-09 | 7.0 | 1 | 10 | 1 | 3 | 1 | 90 |
| 2026-09-15 | 7.0 | 0 | 7 | 2 | 1 | — | 91 |
| 2026-09-23 | 6.0 | 2 | 4 | 1 | 5 | 1 | 88 |
| Chris Sale — last starts | IP | ER | K | BB | H | HR | Pitches |
|---|---|---|---|---|---|---|---|
| 2026-08-21 | 6.0 | 2 | 6 | — | 8 | — | 94 |
| 2026-08-27 | 9.0 | 0 | 11 | — | 5 | — | 109 |
| 2026-09-04 | 6.0 | 2 | 7 | 1 | 6 | 1 | 103 |
| 2026-09-11 | 7.0 | 3 | 6 | 2 | 3 | — | 94 |
| 2026-09-23 | 5.2 | 1 | 10 | — | 4 | 1 | 97 |
Dodgers have scored 801 runs in 162 games (4.94 per game) with a .762 OPS. Braves have scored 742 in 162 (4.58) with a .718 OPS. The pitching staffs have allowed 3.70 and 3.86 runs per game.
| Club | Record | R/G | OPS | Staff ERA | Staff WHIP | RA/G |
|---|---|---|---|---|---|---|
| Dodgers | 1–1 | 4.94 | .762 | 3.55 | 1.14 | 3.70 |
| Braves | 1–1 | 4.58 | .718 | 3.63 | 1.24 | 3.86 |
Yoshinobu Yamamoto averages 6.61 innings per start. Chris Sale averages 6.02. Weight each starter's own earned run average across that length, then hand the remainder of the nine innings to his club's season staff rate. That is a conservative relief proxy — it mixes rotation and bullpen — and it is stated as a limitation, not hidden.
| Side | Starter IP | Starter ERA | Relief IP | Staff ERA | Projected ER |
|---|---|---|---|---|---|
| Dodgers (Yoshinobu Yamamoto) | 6.61 | 2.53 | 2.39 | 3.55 | 2.80 |
| Braves (Chris Sale) | 6.02 | 2.16 | 2.98 | 3.63 | 2.65 |
| Combined | 5.45 |
A combined 5.45 projected earned runs against a 7.0 total. Unearned runs are ignored. Neither starter hits his average length every night. The opposing lineups are not in the formula; they sit in the table above.
Truist Park is listed at 335 feet to left, 385 feet to left center, 400 feet to center, 375 feet to right center, 325 feet to right, on grass, open at 1001 feet above sea level with a listed capacity of 40,819. Park dimensions do not decide a total by themselves. They decide whether a walk plus a ball in the air becomes two runs or a long out.
The season run rates do not want this number. Combined they sit at 9.52 against a 7.0 total, a gap of 2.52 runs that the starters and the park have to close. Yoshinobu Yamamoto also allows 0.97 home runs per nine, and one three-run ball turns a low-event night into a push or a loss.
A start from either pitcher that ends before the fifth with a pitch count above 95, or a walk total of four-plus from Yoshinobu Yamamoto, is the cleanest failure signal. That is how a 7.0 total gets away: free baserunners, an early bullpen, and a second time through a lineup that already scores 4.94 runs a night on the higher side.
Dodgers/Braves Under 7 at -145, 3 units. A price of -145 implies a 59.2% break-even. Grade it against this published number. If a listed starter is scratched, the play is void.
Yoshinobu Yamamoto for Dodgers. Chris Sale for Braves. Those names come from the MLB probable-pitcher feed, not from a guessed rotation.
Earned run average is a counting result. Strikeout and walk rates as a share of batters faced describe the process that produced it, and they stabilize on a smaller sample. Yoshinobu Yamamoto at 19.8 points of K−BB separation versus Chris Sale at 26.1 is the comparison ERA hides.
Against the published price, on the public record. Pending is not a win. Today's full card lives at a stable URL: mlb-picks.html.
Pick, odds, and unit size come from the BetLegend daily tracker. Probable starters, season rates, and venue facts are from the MLB Stats API. Educational analysis. 18+ only. 1-800-GAMBLER.
Unlisted vs Gavin Williams at Progressive Field
Published October 5, 2026 · MLB Prediction Data Lab
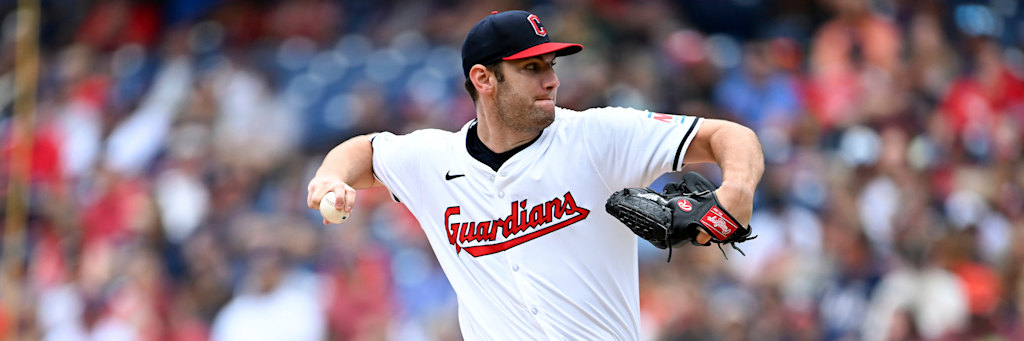
The moneyline on Guardians at -150 is a run-prevention bet first. Unlisted projects 4.17 earned runs allowed across a 5.50-inning start plus relief; Gavin Williams projects 3.76. The side that prevents more does not have to outslug anyone.
Full slate: MLB picks today, October 5, 2026.
Chicago White Sox (1–0) at Cleveland Guardians (0–1), Progressive Field, Cleveland. Unlisted, a starter, is listed for the visitors. Gavin Williams, a right-hander, is listed for the home club. Void the play if either listed starter is scratched.
| Side | Listed starter | Record | Park |
|---|---|---|---|
| White Sox | Unlisted | 1–0 | Progressive Field |
| Guardians | Gavin Williams | 0–1 | Open, grass |
Rate statistics expressed per nine innings reward pitchers who work deep. Expressing them as a share of batters faced removes that distortion. Unlisted has faced — hitters. Gavin Williams has faced 746.
| Starter | BF | K% | BB% | K−BB | K/BB | Pitches/BF |
|---|---|---|---|---|---|---|
| Unlisted | — | — | — | — | — | — |
| Gavin Williams | 746 | 33.2 | 8.2 | 25.1 | 4.07 | 4.01 |
| Starter | W-L | ERA | IP | WHIP | K/9 | BB/9 | HR/9 | Opp AVG |
|---|---|---|---|---|---|---|---|---|
| Unlisted () | —-— | — | — | — | — | — | — | — |
| Gavin Williams (R) | 14-8 | 3.76 | 184.1 | 1.11 | 12.11 | 2.98 | 1.37 | .213 |
Unlisted sits at a — ERA with a — WHIP and — walks in — innings. Gavin Williams sits at a 3.76 ERA with a 1.11 WHIP and 61 walks in 184.1 innings. Walks stabilize faster than earned runs, so the walk column is the more trustworthy August reading.
Season aggregates hide the last month. These are the prior starts, excluding today's outing so the table does not leak a result into a published prediction.
No prior 2026 game log is posted yet for Unlisted.
| Gavin Williams — last starts | IP | ER | K | BB | H | HR | Pitches |
|---|---|---|---|---|---|---|---|
| 2026-09-01 | 7.0 | 0 | 13 | 1 | 2 | — | 97 |
| 2026-09-06 | 6.0 | 2 | 11 | 3 | 4 | — | 99 |
| 2026-09-14 | 5.0 | 2 | 7 | 3 | 4 | — | 113 |
| 2026-09-20 | 7.0 | 0 | 9 | 1 | 3 | — | 89 |
| 2026-09-25 | 3.1 | 4 | 4 | 4 | 5 | 1 | 74 |
White Sox have scored 776 runs in 162 games (4.79 per game) with a .726 OPS. Guardians have scored 678 in 162 (4.19) with a .696 OPS. The pitching staffs have allowed 4.44 and 4.12 runs per game.
| Club | Record | R/G | OPS | Staff ERA | Staff WHIP | RA/G |
|---|---|---|---|---|---|---|
| White Sox | 1–0 | 4.79 | .726 | 4.12 | 1.31 | 4.44 |
| Guardians | 0–1 | 4.19 | .696 | 3.77 | 1.26 | 4.12 |
Unlisted averages 5.50 innings per start. Gavin Williams averages 5.76. Weight each starter's own earned run average across that length, then hand the remainder of the nine innings to his club's season staff rate. That is a conservative relief proxy — it mixes rotation and bullpen — and it is stated as a limitation, not hidden.
| Side | Starter IP | Starter ERA | Relief IP | Staff ERA | Projected ER |
|---|---|---|---|---|---|
| White Sox (Unlisted) | 5.50 | 4.20 | 3.50 | 4.12 | 4.17 |
| Guardians (Gavin Williams) | 5.76 | 3.76 | 3.24 | 3.77 | 3.76 |
| Combined | 7.93 |
A combined 7.93 projected earned runs. Unearned runs are ignored. Neither starter hits his average length every night. The opposing lineups are not in the formula; they sit in the table above.
Progressive Field is listed at 325 feet to left, 410 feet to left center, 405 feet to center, 375 feet to right center, 325 feet to right, on grass, open at 653 feet above sea level with a listed capacity of 34,830. Park dimensions do not decide a total by themselves. They decide whether a walk plus a ball in the air becomes two runs or a long out.
Moneyline edges this thin die when the length assumption fails. If the better starter is out in the fourth, the staff rate takes over and the partition no longer applies.
A short outing from the starter on the backed side, or a crooked inning against the relief bucket that the partition treats as average, is the miss. The model is only as good as the length assumption of 5.50 and 5.76 innings.
Guardians ML at -150, 1 units. A price of -150 implies a 60.0% break-even. Grade it against this published number. If a listed starter is scratched, the play is void.
Unlisted for White Sox. Gavin Williams for Guardians. Those names come from the MLB probable-pitcher feed, not from a guessed rotation.
Earned run average is a counting result. Strikeout and walk rates as a share of batters faced describe the process that produced it, and they stabilize on a smaller sample. Unlisted at — points of K−BB separation versus Gavin Williams at 25.1 is the comparison ERA hides.
Against the published price, on the public record. Pending is not a win. Today's full card lives at a stable URL: mlb-picks.html.
Pick, odds, and unit size come from the BetLegend daily tracker. Probable starters, season rates, and venue facts are from the MLB Stats API. Educational analysis. 18+ only. 1-800-GAMBLER.
Cam Schlittler vs Freddy Peralta at Tropicana Field
Published October 5, 2026 · MLB Prediction Data Lab
The posted total is 4.5. A naive add of season run rates (4.59 for Yankees, 4.54 for Rays) gets you 9.13 combined runs. That is not the bet. The bet is that Cam Schlittler and Freddy Peralta plus Tropicana Field pull the night below that baseline. Partitioning each starter's own earned-run rate across expected innings and handing the remainder to each club's season staff rate returns 6.52 projected earned runs.
This is the largest stake on today's card. The other unders the same night load on the same run-environment factor; size the card as one bet, not seven independent shots. Full board: MLB picks today.
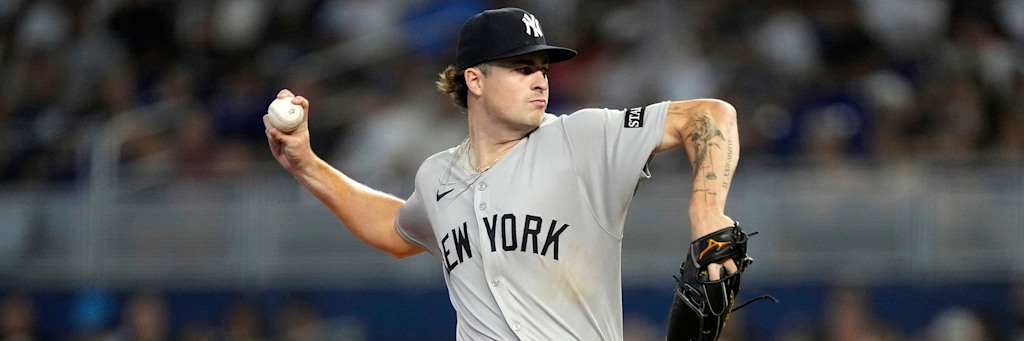
New York Yankees (0–1) at Tampa Bay Rays (1–0), Tropicana Field, St. Petersburg. Cam Schlittler, a right-hander, is listed for the visitors. Freddy Peralta, a right-hander, is listed for the home club. Void the play if either listed starter is scratched.
| Side | Listed starter | Record | Park |
|---|---|---|---|
| Yankees | Cam Schlittler | 0–1 | Tropicana Field |
| Rays | Freddy Peralta | 1–0 | Dome, artificial turf |
Rate statistics expressed per nine innings reward pitchers who work deep. Expressing them as a share of batters faced removes that distortion. Cam Schlittler has faced 761 hitters. Freddy Peralta has faced 730.
| Starter | BF | K% | BB% | K−BB | K/BB | Pitches/BF |
|---|---|---|---|---|---|---|
| Cam Schlittler | 761 | 31.4 | 6.4 | 25.0 | 4.88 | 4.00 |
| Freddy Peralta | 730 | 21.4 | 8.6 | 12.7 | 2.48 | 4.05 |
| Starter | W-L | ERA | IP | WHIP | K/9 | BB/9 | HR/9 | Opp AVG |
|---|---|---|---|---|---|---|---|---|
| Cam Schlittler (R) | 14-6 | 1.95 | 193.2 | 0.92 | 11.11 | 2.28 | 0.74 | .185 |
| Freddy Peralta (R) | 10-11 | 4.42 | 169.0 | 1.33 | 8.31 | 3.36 | 1.22 | .247 |
Cam Schlittler sits at a 1.95 ERA with a 0.92 WHIP and 49 walks in 193.2 innings. Freddy Peralta sits at a 4.42 ERA with a 1.33 WHIP and 63 walks in 169.0 innings. Walks stabilize faster than earned runs, so the walk column is the more trustworthy August reading.
Season aggregates hide the last month. These are the prior starts, excluding today's outing so the table does not leak a result into a published prediction.
| Cam Schlittler — last starts | IP | ER | K | BB | H | HR | Pitches |
|---|---|---|---|---|---|---|---|
| 2026-09-02 | 8.0 | 1 | 9 | — | 2 | 1 | 99 |
| 2026-09-08 | 7.0 | 1 | 10 | — | 3 | 1 | 96 |
| 2026-09-13 | 6.0 | 0 | 8 | 2 | 1 | — | 94 |
| 2026-09-19 | 6.0 | 1 | 6 | 3 | 3 | — | 98 |
| 2026-09-24 | 3.0 | 1 | 5 | 2 | 3 | — | 70 |
| Freddy Peralta — last starts | IP | ER | K | BB | H | HR | Pitches |
|---|---|---|---|---|---|---|---|
| 2026-09-01 | 6.0 | 1 | 7 | — | 3 | 1 | 74 |
| 2026-09-08 | 6.0 | 1 | 2 | 1 | 5 | — | 92 |
| 2026-09-13 | 5.0 | 0 | 4 | 3 | — | — | 86 |
| 2026-09-19 | 5.2 | 1 | 6 | 2 | 4 | — | 97 |
| 2026-09-25 | 5.1 | 0 | 4 | 3 | 4 | — | 93 |
Yankees have scored 739 runs in 161 games (4.59 per game) with a .720 OPS. Rays have scored 736 in 162 (4.54) with a .728 OPS. The pitching staffs have allowed 3.73 and 4.01 runs per game.
| Club | Record | R/G | OPS | Staff ERA | Staff WHIP | RA/G |
|---|---|---|---|---|---|---|
| Yankees | 0–1 | 4.59 | .720 | 3.23 | 1.17 | 3.73 |
| Rays | 1–0 | 4.54 | .728 | 3.70 | 1.14 | 4.01 |
Cam Schlittler averages 5.87 innings per start. Freddy Peralta averages 5.28. Weight each starter's own earned run average across that length, then hand the remainder of the nine innings to his club's season staff rate. That is a conservative relief proxy — it mixes rotation and bullpen — and it is stated as a limitation, not hidden.
| Side | Starter IP | Starter ERA | Relief IP | Staff ERA | Projected ER |
|---|---|---|---|---|---|
| Yankees (Cam Schlittler) | 5.87 | 1.95 | 3.13 | 3.23 | 2.40 |
| Rays (Freddy Peralta) | 5.28 | 4.42 | 3.72 | 3.70 | 4.12 |
| Combined | 6.52 |
A combined 6.52 projected earned runs against a 4.5 total. Unearned runs are ignored. Neither starter hits his average length every night. The opposing lineups are not in the formula; they sit in the table above.
Tropicana Field is listed at 315 feet to left, 410 feet to left center, 404 feet to center, 404 feet to right center, 322 feet to right, on artificial turf, dome at 15 feet above sea level with a listed capacity of 25,025. Park dimensions do not decide a total by themselves. They decide whether a walk plus a ball in the air becomes two runs or a long out.
The season run rates do not want this number. Combined they sit at 9.13 against a 4.5 total, a gap of 4.63 runs that the starters and the park have to close. Freddy Peralta also allows 1.22 home runs per nine, and one three-run ball turns a low-event night into a push or a loss.
A start from either pitcher that ends before the fifth with a pitch count above 95, or a walk total of four-plus from Freddy Peralta, is the cleanest failure signal. That is how a 4.5 total gets away: free baserunners, an early bullpen, and a second time through a lineup that already scores 4.59 runs a night on the higher side.
Rays TT Under 4.5 at -360, 3 units. A price of -360 implies a 78.3% break-even. Grade it against this published number. If a listed starter is scratched, the play is void.
Cam Schlittler for Yankees. Freddy Peralta for Rays. Those names come from the MLB probable-pitcher feed, not from a guessed rotation.
Earned run average is a counting result. Strikeout and walk rates as a share of batters faced describe the process that produced it, and they stabilize on a smaller sample. Cam Schlittler at 25.0 points of K−BB separation versus Freddy Peralta at 12.7 is the comparison ERA hides.
Against the published price, on the public record. Pending is not a win. Today's full card lives at a stable URL: mlb-picks.html.
Pick, odds, and unit size come from the BetLegend daily tracker. Probable starters, season rates, and venue facts are from the MLB Stats API. Educational analysis. 18+ only. 1-800-GAMBLER.
18+ only. Affiliate books are disclosed on the sportsbook page. Compare the live number before betting.