Athletics vs Mariners Prediction, September 3, 2026 | Seattle Mariners -1
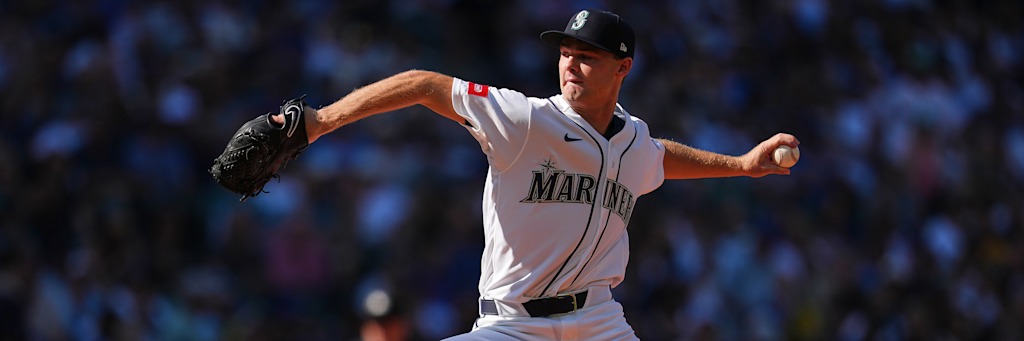
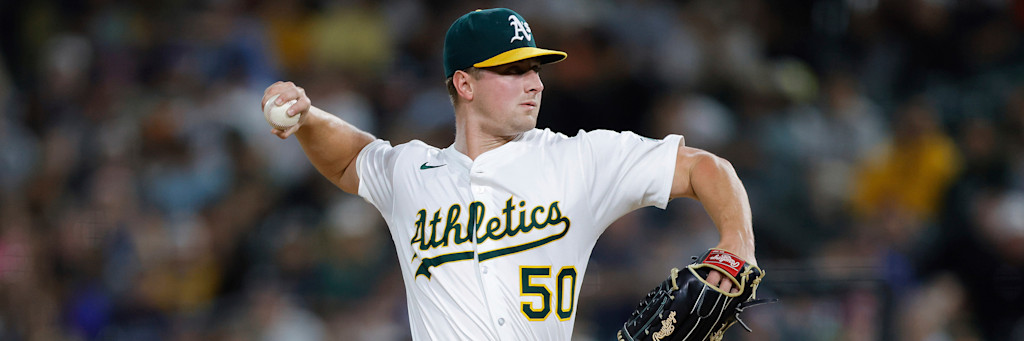
Jack Perkins vs Kade Anderson at T-Mobile Park
Published September 3, 2026 · MLB Prediction Data Lab
The published play is Seattle Mariners -1 at -160 for 2 units. The numbers below are 2026 season rates from MLB Stats API, not a recap of a result that has not been graded.
This is the largest stake on today's card. The other unders the same night load on the same run-environment factor; size the card as one bet, not seven independent shots. Full board: MLB picks today.
The listed matchup
Athletics (54–86) at Seattle Mariners (66–74), T-Mobile Park, Seattle. Jack Perkins, a right-hander, is listed for the visitors. Kade Anderson, a left-hander, is listed for the home club. Void the play if either listed starter is scratched.
| Side | Listed starter | Record | Park |
|---|---|---|---|
| Athletics | Jack Perkins | 54–86 | T-Mobile Park |
| Mariners | Kade Anderson | 66–74 | Retractable, grass |
The two starters, measured per batter faced
Rate statistics expressed per nine innings reward pitchers who work deep. Expressing them as a share of batters faced removes that distortion. Jack Perkins has faced 433 hitters. Kade Anderson has faced 41.
| Starter | BF | K% | BB% | K−BB | K/BB | Pitches/BF |
|---|---|---|---|---|---|---|
| Jack Perkins | 433 | 25.2 | 9.7 | 15.5 | 2.60 | 3.86 |
| Kade Anderson | 41 | 19.5 | 12.2 | 7.3 | 1.60 | 4.05 |
| Starter | W-L | ERA | IP | WHIP | K/9 | BB/9 | HR/9 | Opp AVG |
|---|---|---|---|---|---|---|---|---|
| Jack Perkins (R) | 3-10 | 6.42 | 95.1 | 1.49 | 10.29 | 3.97 | 1.70 | .265 |
| Kade Anderson (L) | —-— | 4.50 | 10.0 | 1.30 | 7.20 | 4.50 | 1.80 | .229 |
Jack Perkins sits at a 6.42 ERA with a 1.49 WHIP and 42 walks in 95.1 innings. Kade Anderson sits at a 4.50 ERA with a 1.30 WHIP and 5 walks in 10.0 innings. Walks stabilize faster than earned runs, so the walk column is the more trustworthy August reading.
Direction inside the season
Season aggregates hide the last month. These are the prior starts, excluding today's outing so the table does not leak a result into a published prediction.
| Jack Perkins — last starts | IP | ER | K | BB | H | HR | Pitches |
|---|---|---|---|---|---|---|---|
| 2026-08-07 | 3.0 | 5 | 3 | 3 | 5 | 1 | 70 |
| 2026-08-12 | 5.0 | 6 | 2 | 1 | 12 | 1 | 97 |
| 2026-08-18 | 3.2 | 0 | 4 | 1 | 1 | — | 53 |
| 2026-08-23 | 5.0 | 1 | 6 | 5 | 3 | 1 | 91 |
| 2026-08-29 | 5.0 | 1 | 5 | 4 | 4 | 1 | 80 |
| Kade Anderson — last starts | IP | ER | K | BB | H | HR | Pitches |
|---|---|---|---|---|---|---|---|
| 2026-08-22 | 5.2 | 3 | 5 | 2 | 5 | 2 | 81 |
| 2026-08-29 | 4.1 | 2 | 3 | 3 | 3 | — | 85 |
The run environment, before the starters
Athletics have scored 611 runs in 140 games (4.36 per game) with a .722 OPS. Mariners have scored 555 in 140 (3.96) with a .685 OPS. The pitching staffs have allowed 5.75 and 4.43 runs per game.
| Club | Record | R/G | OPS | Staff ERA | Staff WHIP | RA/G |
|---|---|---|---|---|---|---|
| Athletics | 54–86 | 4.36 | .722 | 5.45 | 1.50 | 5.75 |
| Mariners | 66–74 | 3.96 | .685 | 4.18 | 1.25 | 4.43 |
Reassembling the buckets
Jack Perkins averages 7.94 innings per start. Kade Anderson averages 5.00. Weight each starter's own earned run average across that length, then hand the remainder of the nine innings to his club's season staff rate. That is a conservative relief proxy — it mixes rotation and bullpen — and it is stated as a limitation, not hidden.
| Side | Starter IP | Starter ERA | Relief IP | Staff ERA | Projected ER |
|---|---|---|---|---|---|
| Athletics (Jack Perkins) | 7.94 | 6.42 | 1.06 | 5.45 | 6.31 |
| Mariners (Kade Anderson) | 5.00 | 4.50 | 4.00 | 4.18 | 4.36 |
| Combined | 10.66 |
A combined 10.66 projected earned runs. Unearned runs are ignored. Neither starter hits his average length every night. The opposing lineups are not in the formula; they sit in the table above.
The park
T-Mobile Park is listed at 331 feet to left, 390 feet to left center, 405 feet to center, 387 feet to right center, 327 feet to right, on grass, retractable at 10 feet above sea level with a listed capacity of 47,929. Park dimensions do not decide a total by themselves. They decide whether a walk plus a ball in the air becomes two runs or a long out.
Where this reading is weakest
Moneyline edges this thin die when the length assumption fails. If the better starter is out in the fourth, the staff rate takes over and the partition no longer applies.
What would falsify it
A short outing from the starter on the backed side, or a crooked inning against the relief bucket that the partition treats as average, is the miss. The model is only as good as the length assumption of 7.94 and 5.00 innings.
The position
Seattle Mariners -1 at -160, 2 units. A price of -160 implies a 61.5% break-even. Grade it against this published number. If a listed starter is scratched, the play is void.
- Seattle Mariners -1 -160 · 2u
Who is on the mound?
Jack Perkins for Athletics. Kade Anderson for Mariners. Those names come from the MLB probable-pitcher feed, not from a guessed rotation.
Why use batters-faced rates instead of ERA?
Earned run average is a counting result. Strikeout and walk rates as a share of batters faced describe the process that produced it, and they stabilize on a smaller sample. Jack Perkins at 15.5 points of K−BB separation versus Kade Anderson at 7.3 is the comparison ERA hides.
How is the pick graded?
Against the published price, on the public record. Pending is not a win. Today's full card lives at a stable URL: mlb-picks.html.
Pick, odds, and unit size come from the BetLegend daily tracker. Probable starters, season rates, and venue facts are from the MLB Stats API. Educational analysis. 18+ only. 1-800-GAMBLER.