Yankees vs Orioles Prediction, August 20, 2026 | Yankees moneyline
Both Halves Of The Game Belong To The Same Team
Published August 20, 2026 | Run Prevention Partition Model | MLB Prediction Data Lab
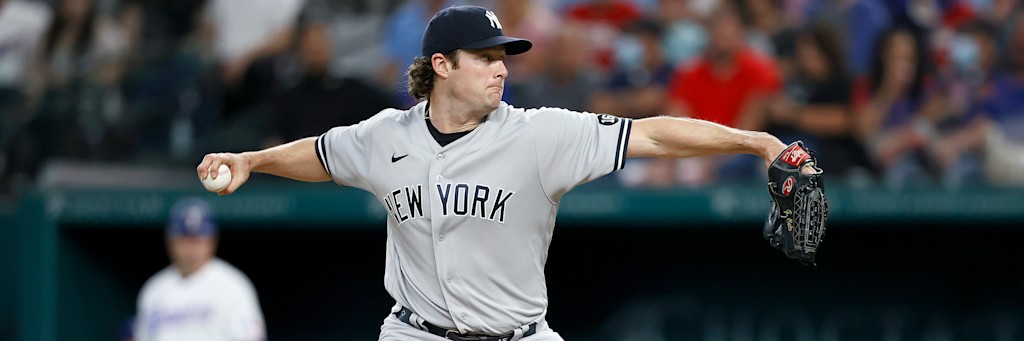
Twenty seven outs have to come from somewhere. In a modern game they come from two distinct populations with two distinct run rates, the starting pitcher and the relief corps behind him, and those populations are almost never equally good. This model stops treating a team as one pitching staff. It partitions the nine innings into a starter bucket and a relief bucket, prices each bucket with 2026 rate data, then reassembles them. Applied to the New York Yankees at the Baltimore Orioles at Oriole Park at Camden Yards, the partition returns the same answer twice.
The Partition
Both clubs have played essentially the same number of innings this season, which makes the comparison unusually clean. New York's staff has covered 1,125.2 innings. Baltimore's has covered 1,128.2. The split between rotation and bullpen is nearly identical on both sides as well, which removes the usual complaint that one manager simply asks more of his starters.
| Bucket | Club | Innings | ERA | WHIP | Opp AVG | HR |
|---|---|---|---|---|---|---|
| Starter outs | New York | 676.1 | 3.38 | 1.16 | .226 | 79 |
| Starter outs | Baltimore | 674.1 | 4.31 | 1.39 | .264 | 84 |
| Relief outs | New York | 449.1 | 3.02 | 1.20 | .220 | 46 |
| Relief outs | Baltimore | 454.1 | 4.14 | 1.29 | .239 | 51 |
New York wins the starter bucket by 0.93 earned runs per nine and the relief bucket by 1.12. There is no exit ramp in this game. Whatever inning the starters leave in, the side that inherits the ball is still worse for Baltimore than it is for New York.
That second row matters more than it looks. The most common objection to backing a Cole start in 2026 is his workload, and the implicit assumption inside that objection is that handing innings to a bullpen is a downgrade. For this particular team it is not. The Yankees relief corps has a lower earned run average than the Yankees rotation, 3.02 against 3.38, and a lower opponent batting average, .220 against .226. Passing the ball is not a tax here.
The Two Starters, Measured Per Batter Faced
Rate statistics expressed per nine innings reward pitchers who work deep and punish pitchers who do not. Expressing them as a share of total batters faced removes that distortion, and it is the only fair way to compare a 15 start season against a 24 start season.
| Starter | BF | K Rate | BB Rate | Separation | K/BB | Pitches per BF |
|---|---|---|---|---|---|---|
| Gerrit Cole | 353 | 26.1 | 5.4 | 20.7 | 4.84 | 3.78 |
| Kyle Bradish | 562 | 22.1 | 10.3 | 11.7 | 2.14 | 3.92 |
Nine points of separation is a large gap. Almost all of it comes from the walk column rather than the strikeout column, and walks are the component that stabilizes fastest, which means this reading is more trustworthy in August than a comparison of earned run averages would be.
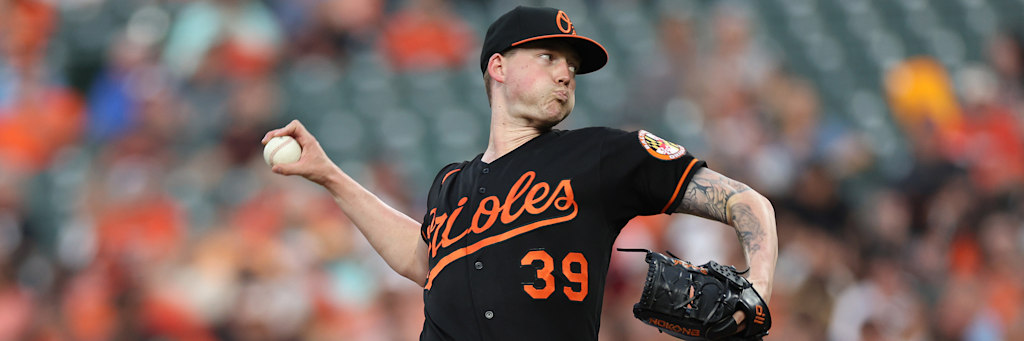
Bradish carries a 3.65 earned run average across 133.0 innings. His component profile does not support it. A 1.36 WHIP, 58 walks, a .248 opponent batting average and a 2.14 strikeout to walk ratio describe a pitcher whose results have outrun his process. Cole sits at a 3.22 earned run average with a 1.08 WHIP and 19 walks in 86.2 innings, and his components are, if anything, slightly better than his results.
The Trend Inside The Trend
Season aggregates hide direction. Both pitchers have moved, in opposite directions.
Cole's last five starts cover 31.2 innings with 37 strikeouts, seven walks and seven earned runs, a 1.99 earned run average. His pitch counts over that stretch read 93, 99, 99, 82 and 87. He recorded 11 strikeouts against Pittsburgh on July 22 without issuing a walk, and repeated the zero walk performance on August 8 against Atlanta while going seven innings.
Bradish has gone the other way. His last four starts produced 14 strikeouts across 19.2 innings. On August 2 against Philadelphia his outing ended after 3.0 innings and 53 pitches. On August 15 against Tampa Bay he walked four hitters in 6.0 innings and struck out three. A collapsing strikeout rate paired with a stable walk rate is the least attractive combination a starting pitcher can present, because it moves more balls into play behind a defense that is already allowing a .254 opponent average as a staff.
Reassembling The Buckets
Cole averages 5.78 innings per start. Bradish averages 5.54. Weight each starter's own earned run average across his expected innings, then hand the remainder to his club's relief rate, and the partition produces a projected earned runs allowed figure for each side.
| Side | Starter IP | Starter rate | Relief IP | Relief rate | Projected ER allowed |
|---|---|---|---|---|---|
| New York | 5.78 | 3.22 | 3.22 | 3.02 | 3.15 |
| Baltimore | 5.54 | 3.65 | 3.46 | 4.14 | 3.84 |
A gap of 0.69 earned runs across nine innings. That figure carries three caveats worth stating plainly. It uses earned runs, so it ignores the unearned variety entirely. It assumes each starter hits his season average length, which neither pitcher does consistently. And it takes no account of the opposing lineups, which is a real omission because both offenses are below average: New York posts a .715 team OPS and ranks 17th, Baltimore a .718 and ranks 16th.
The partition still points where the season points. New York has allowed 470 runs in 126 games and owns the lowest team earned run average in Major League Baseball at 3.24. Baltimore has allowed 604 in 127 and ranks 19th at 4.23. The run differential is plus 89 against minus 31.
Where This Model Is Weakest
Three inputs argue against the output, and none of them are trivial.
The first is the length assumption. Cole has thrown 86.2 innings across 15 starts and has never once reached the end of a seventh inning this year. His season high pitch count is 103. If his true expected length is closer to five innings than to 5.78, more of the game shifts into the relief bucket, and while that bucket is good, it is also where variance lives.
The second is the Baltimore approach, which is the specific mechanism that shortens starts. The Orioles have drawn 488 walks, third most in baseball behind the Cubs at 544 and the Brewers at 534, at a 10.15 percent rate of their 4,808 plate appearances. At home they have taken 260 walks in 64 games. Pete Alonso has 63 walks and a .359 on base percentage across 551 plate appearances. Gunnar Henderson has 52. Jackson Holliday has 34 in 259 trips with a .333 on base percentage. This is a lineup that can convert a command advantage into a pitch count problem.
The third is a venue split that runs against the model. Bradish has a 3.34 earned run average at Camden Yards with a 1.16 WHIP and a .188 opponent batting average across 59.1 innings, against 3.91, 1.52 and .293 on the road. Cole reverses that pattern: a 0.87 WHIP and a .192 opponent average at home, 1.29 and .257 away. The partition uses combined figures, and the venue specific figures narrow the gap noticeably.
One more input belongs in this column. New York's offense drops away from the Bronx, hitting .227 with a .299 on base percentage and a .683 OPS in 68 road games, with 656 strikeouts in those games against a .753 OPS at home. Run prevention alone does not score.
What Would Falsify It
A Cole start that ends in the fifth inning with a pitch count above 95 is the clearest failure signal, because it means the walk suppression that anchors the whole model did not hold against the one lineup built to test it. A Bradish start of six or more innings with fewer than two walks would be the second, because it would mean the venue split is describing something real rather than sequencing luck.
The park will not be neutral either way. Oriole Park at Camden Yards is listed at 333 feet down the left field line, 376 to left center, 410 to center, 373 to right center and 318 down the right field line, on grass, under an open roof, 33 feet above sea level. That right field corner turns any walk into a two run mistake waiting for one bad pitch.
The Position
New York Yankees moneyline at -107, one unit. A price of -107 implies a 51.69 percent break even. The partition model, the season aggregates and the first two games of this series at Camden Yards all point to a number higher than that. The Yankees have won three straight and are 40-28 away from home. Baltimore has lost three straight and sits 15.5 games out at 61-66.
What is the partition model measuring?
It splits the 27 outs a team must record into a starter bucket and a relief bucket, applies each club's own 2026 earned run average for that bucket, and adds them. New York is at 3.38 for starters and 3.02 for relievers. Baltimore is at 4.31 and 4.14. The Yankees hold the advantage in both halves.
Why express strikeout and walk rates per batter faced?
Because per nine innings figures reward pitchers who work deep. Cole has faced 353 hitters in 15 starts, Bradish 562 in 24. A rate expressed as a share of batters faced compares them on the same footing: 26.1 percent strikeouts and 5.4 percent walks for Cole, 22.1 and 10.3 for Bradish.
What is the strongest counterargument?
Bradish is meaningfully better at Camden Yards than away from it, carrying a 3.34 earned run average and a .188 opponent batting average across 59.1 home innings. Cole is the reverse, with a 1.29 WHIP on the road against 0.87 at home. Add a Baltimore lineup that draws walks at a 10.15 percent rate and a Cole workload that has never passed seven innings, and the gap the model reports narrows.