Royals vs Red Sox Prediction, August 17, 2026 | Royals moneyline
The Innings Nobody Counts Until The Sixth
Published August 17, 2026 | Bullpen Exposure Index | MLB Prediction Data Lab
A staff earned run average is an average of two very different jobs. Kansas City's overall mark of 4.78 is the blend of a rotation at 4.47 and a relief corps at 5.27, and those two numbers get applied to wildly different shares of a game depending on who starts. This audit separates them. For each of the four clubs on today's two-play card, expected starter innings are taken from that starter's own 2026 workload, the remainder of a nine-inning game is assigned to the bullpen at its relief-only earned run average, and the two blocks are added. The result is a projected runs allowed figure that answers a question a staff ERA cannot: how much of tonight does the weak part have to pitch?
Splitting The Staff In Two
The first step is to stop treating a pitching staff as one thing. Separating each club's 2026 innings into starting and relieving produces four pairs of numbers, and in three of the four cases the two halves disagree sharply about how good the staff is.
| Club | Rotation ERA | Rotation IP | Bullpen ERA | Bullpen IP | Gap |
|---|---|---|---|---|---|
| Boston Red Sox | 3.91 | 639.1 | 2.98 | 462.0 | Bullpen better by 0.93 |
| Arizona Diamondbacks | 4.11 | 687.0 | 4.11 | 423.0 | Identical |
| Kansas City Royals | 4.47 | 660.1 | 5.27 | 437.0 | Bullpen worse by 0.80 |
| Athletics | 5.29 | 605.1 | 5.70 | 494.0 | Bullpen worse by 0.41 |
Boston is the outlier and it is the single most useful fact on this page. The Red Sox relief corps has thrown 462 innings at a 2.98 earned run average, nearly a full run better than its own rotation and the best relief figure of the four clubs by 1.13. Kansas City runs the opposite shape, a rotation at 4.47 and a bullpen at 5.27. Arizona is the rare club whose two halves are indistinguishable.
Expected Starter Innings
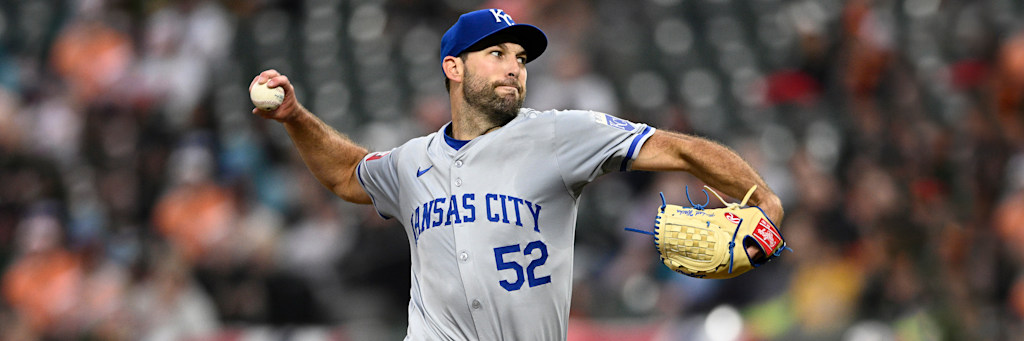
The second input is how long each starter actually lasts, computed from his own season rather than assumed. Michael Wacha has thrown 150.2 innings across 24 starts, 6.28 per outing. Mitch Bratt has thrown 33.2 across seven, 4.81. Mason Barnett has made three starts totaling 13.1 innings, 4.44 per start, and he has not finished five in either of his last two. Alec Gamboa has made zero starts in nine appearances, so there is no starter average to compute at all; his three multi-inning outings this season went 3.0, 4.0 and 3.0 innings, and 3.0 is the conservative planning figure used below.
| Starter | Club | Season IP | Starts | IP Per Start | Bullpen Innings Required |
|---|---|---|---|---|---|
| Michael Wacha | Kansas City | 150.2 | 24 | 6.28 | 2.72 |
| Mitch Bratt | Arizona | 33.2 | 7 | 4.81 | 4.19 |
| Mason Barnett | Athletics | 13.1 as starter | 3 | 4.44 | 4.56 |
| Alec Gamboa | Boston | 17.0, all relief | 0 | 3.00 assumed | 6.00 |
The spread is the point. Wacha hands his bullpen 2.72 innings. Barnett hands his 4.56, and Barnett's bullpen is the worst of the four. Gamboa hands his 6.00, and Gamboa's bullpen is the best of the four by a full run and change. A method that stopped at staff ERA would call Boston's plan the riskier one. This method says the opposite, because it accounts for who is actually throwing those innings.
Projected Runs Allowed
Multiply each block of innings by its own earned run average, divide by nine, and add. Kansas City projects Wacha's 6.28 innings at a 3.46 ERA for 2.41 runs plus 2.72 bullpen innings at 5.27 for 1.59, a total of 4.00. Oakland projects Barnett's 4.44 innings at 6.16 for 3.04 plus 4.56 bullpen innings at 5.70 for 2.89, a total of 5.93.
| Club | Starter Block | Bullpen Block | Projected Runs Allowed |
|---|---|---|---|
| Kansas City Royals | 6.28 IP at 3.46 = 2.41 | 2.72 IP at 5.27 = 1.59 | 4.00 |
| Athletics | 4.44 IP at 6.16 = 3.04 | 4.56 IP at 5.70 = 2.89 | 5.93 |
| Boston Red Sox | 3.00 IP at 1.59 = 0.53 | 6.00 IP at 2.98 = 1.99 | 2.52 |
| Arizona Diamondbacks | 4.81 IP at 3.74 = 2.00 | 4.19 IP at 4.11 = 1.91 | 3.91 |
Kansas City projects to allow 1.93 fewer runs than Oakland. Boston projects to allow 1.39 fewer than Arizona. Both gaps point at the posted favorite, and in both cases the majority of the gap comes from the relief innings rather than the starter block, which is the finding this method exists to surface.
Where The Method Breaks
Earned run average is being used here as a per-inning run rate, and it is an imperfect one. It ignores sequencing entirely, treats leverage as if it does not exist, and excludes unearned runs, which for a bad defensive club is a real omission. A bullpen at 5.27 does not allow 0.586 runs in every inning it pitches; it allows zero in most and four in a few.
The samples underneath two of the four starter blocks are thin enough to argue with. Alec Gamboa's 1.59 earned run average comes from 17 innings and will regress toward something ordinary; using it at face value flatters Boston's projection, and a more conservative substitution of the rotation figure of 3.91 for his three innings would move Boston from 2.52 to 3.29, cutting the gap against Arizona from 1.39 to 0.62. That is still a gap, and it is the honest version of one. Mason Barnett's three starts are similarly thin, though his relief work points the same direction: 20 walks in 167 batters faced across all appearances, a 12.0 percent rate, and eleven home runs allowed in 38 total innings.
The assumed three innings for Gamboa is also a choice rather than a measurement. If Boston stretches him to four, its bullpen block drops to five innings and the projection improves; if he is pulled after two, it worsens. No starter average exists to anchor that, and the page says so rather than manufacturing one.
What The Prices Say Back
Kansas City is posted at -175, which requires 63.6 percent. Boston is posted at -132, which requires 56.9 percent. The exposure index does not convert directly into a win probability, and no claim is made here that it does. What it does is explain why two clubs with unremarkable records, 51-74 and 66-58, are both favored tonight, and why the larger of the two prices sits on the club with the smaller record. The answer in both cases is in the innings after the starter leaves.
Model FAQ
What is the bullpen exposure index?
Expected starter innings are taken from the starter's own 2026 workload, the remaining innings of a nine-inning game are assigned to that club's relief corps, and each block is multiplied by its own earned run average to produce a projected runs allowed figure. It separates the question of how good a staff is from the question of how much of the game that staff's weakest part has to pitch.
Which bullpens are involved on the August 17 card?
Boston's relief corps has a 2.98 ERA across 462 innings, Arizona's a 4.11 across 423, Kansas City's a 5.27 across 437 and Oakland's a 5.70 across 494. Those are relief-only figures, separated from each club's starting rotation.
What does the model project for each game?
Kansas City projects to allow 4.00 runs against Oakland's 5.93, a gap of 1.93. Boston projects to allow 2.52 runs against Arizona's 3.91, a gap of 1.39. Both gaps run in the direction of the posted favorite.
What are the limitations of this method?
Earned run average is used as a per-inning run rate, which ignores sequencing, leverage and unearned runs. Alec Gamboa's 17 innings and Mason Barnett's three starts are small samples that will regress. The method also assumes a nine-inning game and takes no account of the home club batting in the ninth only when it trails.