MLB Picks, August 15, 2026 | Team total under
Two Ways To Count The Same Six Games
Published August 15, 2026 | Two-Estimator Base Rate Audit | MLB Prediction Data Lab
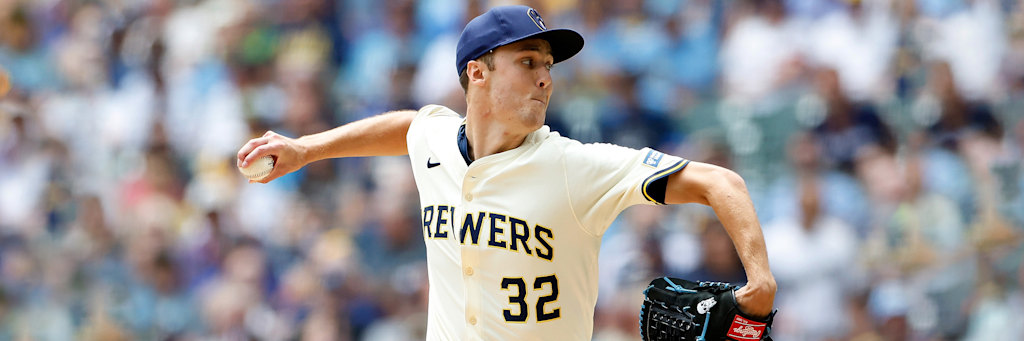
Texas has won 28 of its 64 road games this season, 43.8 percent. Visiting teams at Sutter Health Park have won 39 of 61, 63.9 percent. Both of those numbers are complete enumerations of completed 2026 games, both describe the same Rangers moneyline priced at -141 tonight, and they sit 20.1 percentage points apart. That single disagreement is the reason this audit runs every ticket twice: once against the club that has to perform, once against the building it performs in. Six prices, twelve base rates, and the interesting work is in the places where the two counts refuse to agree.
The Method, Stated Plainly
Every price implies a frequency. A moneyline at -141 needs the event 58.5 percent of the time to break even, and -115 needs 53.5 percent. For each of today's six tickets, two independent frequencies were computed from completed regular season games through August 14. The team-side rate counts how often the club in question has produced the event in the relevant split, home or road. The venue-side rate counts how often visitors or hosts at that specific ballpark have produced it, regardless of who they were.
Neither estimator is the forecast. The team rate carries the contamination of every opponent that club has faced, and the venue rate carries the contamination of every roster that has passed through the park. Where the two agree, the prior is sturdy. Where they diverge by double digits, the honest reading is that most of the information sits in whichever one the starting pitcher makes relevant, and the ticket is a bet on that choice.
| Ticket | Price | Break-Even | Team-Side Rate | Venue-Side Rate |
|---|---|---|---|---|
| Rockies Team Total Under 3.5 (3.0u) | -138 | 58.0% | 50.8% (32 of 63 road games at 3 or fewer) | 51.7% (31 of 60 visitors held to 3 or fewer at Oracle Park) |
| Yankees Moneyline (2.0u) | -166 | 62.4% | 57.8% (37-27 on the road) | 50.0% (32 of 64 visitor wins at Rogers Centre) |
| Rangers Moneyline (2.0u) | -141 | 58.5% | 43.8% (28-36 on the road) | 63.9% (39 of 61 visitor wins at Sutter Health Park) |
| Tigers Moneyline (1.5u) | -134 | 57.3% | 52.5% (32-29 at home) | 52.5% (same sample, Comerica Park) |
| Red Sox Team Total Over 3.5 (1.5u) | -147 | 59.5% | 59.7% (37 of 62 road games at 4 or more) | 62.3% (38 of 61 visitors reaching 4 at PNC Park) |
| Brewers/Dodgers Under 7.5 (1.5u) | -115 | 53.5% | 50.0% (30 of 60 Brewers road games at 7 or fewer) | 47.5% (29 of 61 Dodger Stadium dates at 7 or fewer) |
Where The Two Counts Disagree Most
Start with the Rangers, because that ticket is the outlier and deserves the space. Texas is a genuinely poor road team, 28-36, held to three runs or fewer in 29 of 64 road games, and currently on a four game losing streak with 0 and 3 runs in its last two. On the team estimator alone, a 58.5 percent break-even is 14.7 points out of reach.
The venue estimator points the opposite direction with equal force. The Athletics' home run environment at Sutter Health Park is the most extreme in the sport this season: 439 runs allowed across 61 home dates, 7.20 per game, a 6.55 home ERA, and 122 home runs surrendered in that park against 70 on the road. Home games there have averaged 12.23 combined runs. Visiting clubs have scored four or more in 48 of 61, and the Athletics are 22-39 in their own building. Two separate league data pulls agree on the figure, the enumerated game logs and the club's own home pitching split, which is the confirmation standard this desk requires before printing a number that extreme.
MacKenzie Gore is the variable that decides which estimator matters. His 149 strikeouts in 134 innings, 10.01 per nine with a .229 opponent average, are the sort of profile that carries into a hitter's park better than a contact-suppression profile does, and his August 10 outing was 5.1 innings, four hits, one earned run and nine strikeouts. J.T. Ginn's 3.41 ERA sits on 53 walks in 121.1 innings, 3.93 per nine, and free baserunners are the currency of that ballpark.
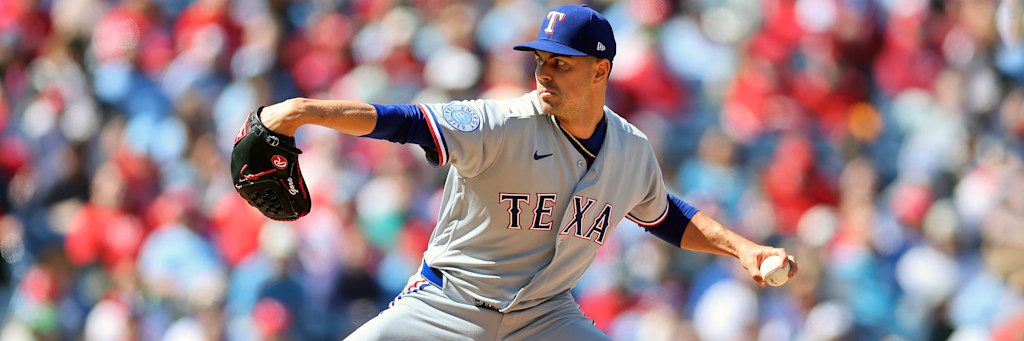
The Rockies Ticket Carries The Largest Stake And The Second Largest Gap
Three units, the biggest position of the day, sit on Colorado finishing under 3.5 runs at -138. Both estimators land in the low fifties against a 58.0 percent requirement, which means roughly six to seven points of the frequency have to come from the starting pitcher.
Logan Webb is a defensible source for that adjustment. His 133 innings across 21 starts carry a 3.59 ERA, a 1.08 WHIP, a .225 opponent average and 0.61 home runs allowed per nine, the lowest home run rate among the twelve starters on this card. His last five starts total 32.2 innings and ten earned runs, closing with eight innings, four hits and one earned run on August 9. Oracle Park supplies the rest of the argument: San Francisco's home staff has allowed 261 runs in 60 dates, 4.35 per game, with 45 home runs conceded at home against 69 on the road.
The One Place The Engine Argues Against The Card
Auditing means reporting the disagreements, including the inconvenient one. The expected runs engine projects Los Angeles at 4.21 runs and Milwaukee at 4.56 tonight, a combined 8.77 against a total of 7.5. On that projection the model wants the over, and the card has 1.5 units on the under at -115.
The case for the under does not come from the engine. It comes from Jacob Misiorowski, whose season is the most extreme starting pitcher line in either league: a 1.76 ERA, a 0.74 WHIP, a .147 opponent average and 204 strikeouts in 133 innings, 13.80 per nine. It also comes from two cold lineups. Milwaukee has scored 4, 5, 6, 4, 4, 2, 2, 3, 5 and 1 over its last ten, Los Angeles 1, 6, 3, 2, 2, 6, 5, 4, 4 and 3.
Trace the engine's disagreement and it lands on the other mound, where it has a point. Justin Wrobleski's 3.44 season ERA conceals a three start stretch of 13.2 innings, fifteen earned runs and nine home runs allowed. A total of 7.5 needs both starters to hold, and only one of them currently is. Both venue estimators also fall short of the price, 47.5 percent at Dodger Stadium and 50.0 percent in Brewers road games against a 53.5 percent break-even. This is the ticket on the card with the least statistical support and it is correctly sized at the minimum.
Where Both Counts Clear The Price
Exactly one ticket has both estimators at or above its break-even. Boston needs to score four or more at -147, a 59.5 percent requirement, and the Red Sox have done it in 37 of 62 road games, 59.7 percent, while visitors to PNC Park have done it in 38 of 61, 62.3 percent. Pittsburgh's home staff has allowed 313 runs in 61 dates, 5.13 per game, and home games there have averaged 10.57 combined runs, which is not the park's reputation. Jared Jones carries a 5.03 ERA and 1.53 home runs allowed per nine across 59 innings, with eleven earned runs in seven innings over his last two starts, including eight in three innings on August 9. The engine projects Boston at 4.65 runs, over the line by 1.15, the second widest margin on the board.
Detroit's ticket is the quiet one on the card. Detroit is 32-29 at home, 52.5 percent against a 57.3 percent break-even, and the gap belongs entirely to Troy Melton: a 1.46 ERA and a 0.90 WHIP across 80 innings in 13 starts, a .171 opponent average, and 20 innings without an earned run over his last three outings. Detroit's home staff has held opponents to three or fewer in 30 of 61 dates. The caution is sample size, since 13 starts is a thin base for a rate that extreme, and Chicago leads the division at 63-58 with 161 home runs.
The Yankees ticket inverts the usual structure. New York is 57.8 percent on the road against a 62.4 percent requirement, and Toronto is 32-32 at home, so neither count reaches the price. What the counts cannot capture is that Toronto's listed starter, Braydon Fisher, has made seven starts this season and none has exceeded 1.1 innings, with 61 total innings across 58 appearances. His July 22 start ran 1.1 innings before six relievers followed. Cam Schlittler brings a 2.21 ERA, a 0.93 WHIP and 182 strikeouts in 146.2 innings to the other side. The projection reflects the structure, 5.42 runs for New York against 2.81 for Toronto, while New York's last ten games produced 7, 2, 1, 3, 5, 1, 4, 10, 0 and 1 runs, which is the reason to hold the stake at two units rather than more.
What The Audit Concludes
Six favorites, 11.5 units, a unit-weighted break-even of 58.4 percent, and only one ticket whose own history clears its price without help. That is a card built almost entirely on adjustments rather than on priors, which is a defensible way to bet an August board and a fragile one. The adjustments are concentrated in three arms with genuinely separating profiles, Webb at 0.61 home runs per nine, Misiorowski at 13.80 strikeouts per nine, Melton at a 1.46 ERA, and in two ballparks behaving at the extremes of the league distribution.
One failure mode runs through all six tickets. If starters go five instead of seven, every one of these tickets hands its decisive innings to a bullpen, and the base rates already included those bullpens at their long run averages. Every count, split, rate and game log figure in this piece was pulled live from official league statistics during this session and computed from completed 2026 regular season games through August 14. Sample sizes are printed beside every base rate they support.