MLB Picks, August 13, 2026 | Team total under
A 0.9 Point Gap And A 6.8 Point Gap
Published August 13, 2026 | Base Rate Audit | MLB Prediction Data Lab
Every price is a claim about frequency, and every frequency claim can be checked against the season that produced it. Tonight's card makes two such claims. The Angels team total under 3.5 at -140 claims the event lands at least 58.3 percent of the time. The Phillies and Twins over 8.5 at -115 claims 53.5 percent. Counted from completed games, the raw base rates behind those claims are 57.4 and 46.7 percent. Neither ticket clears its own bar on history alone, and the distance between price and base rate, 0.9 points on one and 6.8 on the other, is precisely the amount of work each starting pitcher is being paid to do. One structural note before the counting: the Phillies and Twins do not play in Minneapolis tonight. The game is at the Field of Dreams in Dyersville, Iowa, MLB's one-night special-event park, with Minnesota as the designated home team, which changes what the second base rate can honestly claim to measure.
How The Base Rates Were Counted
Both figures come from complete enumeration rather than sampling. For the Angels number, all 61 completed regular season home games in Anaheim this year were graded against the line: in 35 of them, Los Angeles scored three runs or fewer, a 57.4 percent hit rate for the under. For the Twins number, all 60 completed home dates this season were graded against 8.5 combined runs: 28 cleared it, 46.7 percent.
Base rates of this kind carry a known contamination, and it should be stated up front. The 57.4 percent includes every starter the Angels have faced at home, most of them worse than tonight's. The 46.7 percent includes every Twins home game, most started by pitchers with home run rates half of tonight's visitor. The second number carries an extra, larger caveat tonight: every one of those 60 dates was played at Minnesota's regular Minneapolis park, and tonight's game is not. The Field of Dreams has no completed 2026 games to enumerate, so the 46.7 percent survives only as a statement about this lineup and its home-role context, not about tonight's venue. The base rate is the prior, not the forecast, and tonight it is a weaker prior than usual. The interesting question is whether the specific arms on the mound move the number up or down from there, and by how much.
| Play | Price | Break-Even | Empirical Base Rate | Gap |
|---|---|---|---|---|
| Angels Team Total Under 3.5 (1.5u) | -140 | 58.3% | 57.4% (35 of 61 home games) | 0.9 points |
| Phillies/Twins Over 8.5 (0.5u) | -115 | 53.5% | 46.7% (28 of 60 Twins home dates, all in Minneapolis) | 6.8 points |
The unit sizing tracks the gaps in the right direction. The play needing almost no adjustment carries 1.5 units. The play needing a seven point push from its pitchers carries half a unit.
Closing 0.9 Points With A Strikeout Rate
The Angels' home offense is one of the most extreme splits measurable in the league right now. In 61 home games Los Angeles has hit .223/.299/.336 for a .635 OPS and 218 total runs, 3.57 per game. On the road the same roster hits .247/.321/.415 with 78 home runs against 46 at home. Whatever the causal mix of ballpark, lineup construction and schedule, the observed home output of this 47-74 club has been under 3.5 runs more often than not all season, and seven of its last ten games league-wide stayed at three or fewer.
Jacob deGrom is the adjustment term, and he points up, not down. His season line reads 3.87 ERA, 1.13 WHIP, 144 strikeouts against 30 walks in 118.2 innings, a .229 opponent average, 10.92 strikeouts per nine. Strikeout rate is the correct lens for this particular bet because a .336 slugging offense scores through sequencing, singles and traffic rather than one swing, and every strikeout removes a ball in play from that chain. Five days ago, on August 8, deGrom faced this exact lineup in this exact building and produced five innings, three hits, one earned run and nine strikeouts.
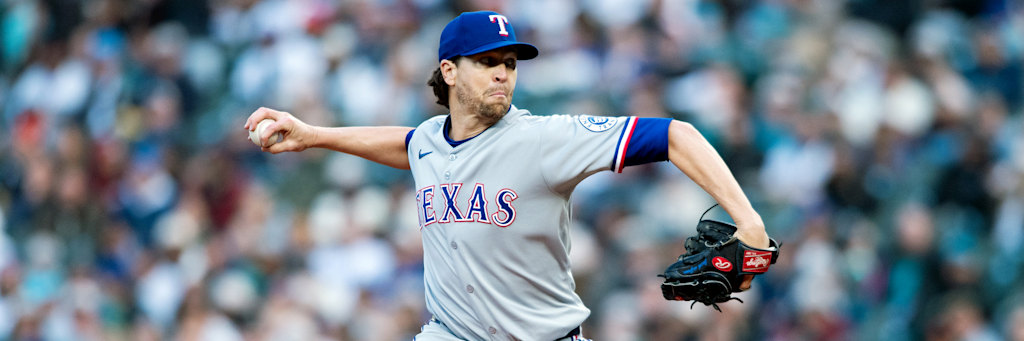
The offsetting variable is innings. deGrom's last five starts lasted 5.0, 4.2, 5.0, 3.1 and 5.0 innings, none reaching the sixth, and the 3.1 inning outing on August 1 included five earned runs and five walks. A team total under is a nine inning bet, and roughly four of those innings will likely belong to a Texas bullpen that has converted 34 of 50 save chances. The bet survives that handoff only because the base rate was built on full games too: the 57.4 percent already includes every middle reliever the Angels have failed to hit at home this year.
Net assessment: a 0.9 point gap, an above-median strikeout arm replacing the average opponent baked into the prior, and a same-building result five days old pointing the right way. Small edge, honestly small, and sized accordingly.
Closing 6.8 Points With A Home Run Rate
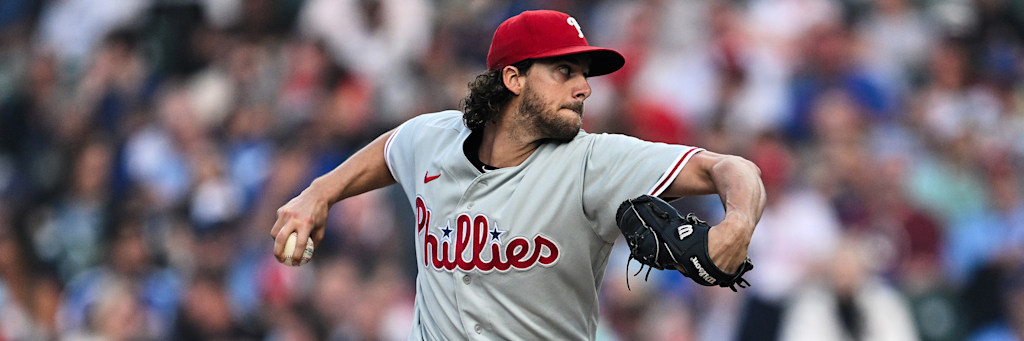
The over needs far more help, and the help has a name. Aaron Nola's 2026 season is a home run event study: 29 allowed in 125 innings, 2.09 per nine, at least one in every one of his last five starts, nine total in that span. Around the home runs sit a 5.47 ERA, a 1.45 WHIP and a .279 opponent average. His 9.29 strikeouts per nine keep the floor from collapsing entirely, but the contact profile is the loudest of any starter on tonight's nine-game slate, and with the game moved to a one-night park in Dyersville that no model has a 2026 read on, his batted-ball profile is the most reliable run-scoring input the matchup offers.
The Minnesota side of the total is quieter and still supportive. Taj Bradley's headline numbers, a 3.76 ERA and .220 opponent average, describe his season; his last three starts describe his August: eight earned runs in 17 innings, with 3.76 walks per nine supplying baserunners ahead of contact. The Twins offense he protects has scored 4.57 runs per game in its home role this season with a .726 OPS in that split, and the two staffs in this game carry ERAs of 4.20 and 4.60.
Recent totals lean the same way. Philadelphia's last ten games cleared 8.5 combined runs seven times. Minnesota's last ten cleared it five times, with combined scores of 13, 10, 14, 14 and 12 in the five that did.
What The Audit Says About The Card
Two plays, and their structures are mirror images. The under buys a base rate that already nearly clears its price and asks the pitcher for one point. The over buys a base rate well short of its price and asks the pitchers for seven. The first structure fails when the sample was misleading, if Anaheim's quiet season was partly luck now due for correction. The second fails when the causal story is wrong, if Nola keeps the ball in the park for one night or Philadelphia's road offense drags the game into the sevens.
A card built this way concentrates its stake where the empirical support is thickest, 1.5 units against 0.9 points of gap, and buys its speculative position at a third of the size. That allocation is the most defensible thing about tonight, more than either individual number.
Every count, split, rate and game log figure in this piece was pulled live from official league statistics during this session and computed from completed 2026 regular season games only. Sample sizes are stated beside every base rate they support.