MLB Picks, August 11, 2026
Eight Plays, Eight Ballparks, A 4.44 Run Spread
Published August 11, 2026 | Venue Baseline Decomposition | MLB Prediction Data Lab
Petco Park has produced 7.75 combined runs per game across sixty-one San Diego home dates this season. Sutter Health Park has produced 12.19 across fifty-eight. That is a 4.44 run spread between two active major league venues, and tonight's twelve-unit card has a play sitting in each of them, plus six more in the ballparks between.
How These Numbers Were Built
Every figure below comes from summing both clubs' final scores in every completed 2026 regular season game at a given venue, then dividing by the number of games played there. No park factor index, no normalization, no adjustment for the quality of visiting opponents. The raw run environment each site has actually produced this year, with the games played in it.
That method has a known weakness worth stating before the tables. A venue baseline built this way is contaminated by the home team's own roster. Sutter Health Park reads high partly because the Athletics have allowed 416 runs there in fifty-eight home games, 7.17 per game, which is a pitching-staff fact as much as a ballpark fact. The number is still the right starting point for a total, because that staff will be on the mound tonight, but calling it a park effect would overstate what has been measured.
| Venue | Home Games | Combined Runs/Game | Play Sitting There |
|---|---|---|---|
| Petco Park | 61 | 7.75 | Brewers/Padres Under 7.5 |
| loanDepot park | 60 | 8.07 | Marlins Team Total Under 3.5 |
| Busch Stadium | 64 | 8.23 | Phillies Moneyline |
| Comerica Park | 57 | 8.26 | Guardians +1.5 |
| Dodger Stadium | 57 | 8.54 | Royals/Dodgers Under 8.5 |
| Truist Park | 61 | 8.98 | Braves Team Total Under 4.5 |
| Chase Field | 61 | 9.15 | Diamondbacks Team Total Over 4.5 |
| Sutter Health Park | 58 | 12.19 | Rays Moneyline |
The Gap Each Starter Has To Close
A total is a forecast, and the useful way to read one is as a baseline plus a residual. The baseline is what the situation already produces without any information about tonight's arms. The residual is everything the starting pitcher has to supply on top of that to move the result across the line.
Running that subtraction produces the single most informative table on this slate.
| Play | Baseline | Line | Residual Needed |
|---|---|---|---|
| Marlins Team Total Under 3.5 | 4.43 MIA runs/game at home | 3.5 | -0.93 |
| Braves Team Total Under 4.5 | 5.07 ATL runs/game at home | 4.5 | -0.57 |
| Brewers/Padres Under 7.5 | 7.75 at Petco | 7.5 | -0.25 |
| Royals/Dodgers Under 8.5 | 8.54 at Dodger Stadium | 8.5 | -0.04 |
| Diamondbacks Team Total Over 4.5 | 4.77 ARI runs/game at home | 4.5 | +0.27 already |
The Residual, Priced By Arm
Take those five in ascending order of difficulty, because that ordering is not the same as the ordering of the prices.
The Royals and Dodgers under at -115 asks almost nothing of the venue and quite a lot of the unknown. Michael Wacha has allowed four earned runs across his last three starts and 18.2 innings, and Kansas City scores 3.61 runs per game on the road with a .671 OPS, 220 runs in sixty-one away games. The complication is Blake Snell, who has made exactly one start this season, on May 9, lasting three innings and four earned runs on seventy-seven pitches. A single outing is not an estimate of anything, and the failure mode an under fears is a short start that turns the fourth inning over to relievers.
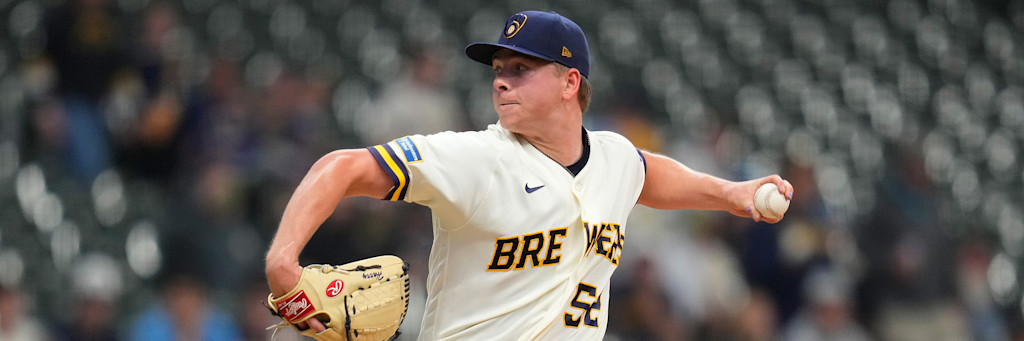
A quarter run is what the Brewers and Padres under needs, and Kyle Harrison supplies it in expectation: a 2.84 ERA, a 1.04 WHIP, 111 strikeouts in 88.2 innings, working a four-seam fastball at 57.8 percent usage and 95.0 mph alongside a slurve at 30.9 percent and 82.1. San Diego's own bats have been the quiet half of the equation, hitting .229/.311/.361 at Petco for 3.84 runs a game. Walker Buehler is the offsetting term, at 5.07 with a 1.46 WHIP and forty-five walks in 108.1 innings, against a Milwaukee club that has drawn 492 walks and posts a .336 on-base percentage.
The Braves team total under needs 0.57 runs of suppression against the highest home scoring rate on the card. Atlanta hits .260/.325/.438 at Truist and scores 5.07 per game there. Nolan McLean is the entire residual: a 3.51 ERA, 156 strikeouts in 130.2 innings, a .216 opponent average, and a sinker at 32.5 percent usage and 95.1 mph that drives a 1.29 ground-out to air-out ratio, the highest among visiting starters tonight. He held Atlanta to two earned across six innings at Truist on July 5. His August 6 outing in Cleveland went five innings and five earned.
Largest ask and largest stake both belong to the Marlins team total under, two units at -147. Paul Skenes has the profile to supply a full run of suppression, with a 1.12 WHIP, a .226 opponent average and 162 strikeouts in 129.2 innings behind a four-seam fastball at 41.0 percent usage and 96.9 mph. His last three starts do not: thirteen earned runs and ten walks in 14.1 innings, with none of the three reaching the sixth inning. When a starter averages under five innings, the residual stops belonging to him and passes to a Pittsburgh bullpen attached to a 4.34 staff ERA and twenty blown saves.
Strikeout Rate As Exposure To The Venue
Tampa Bay's moneyline is not a total, yet it is the play most directly conditioned on a run environment, and the mechanism behind that is measurable.
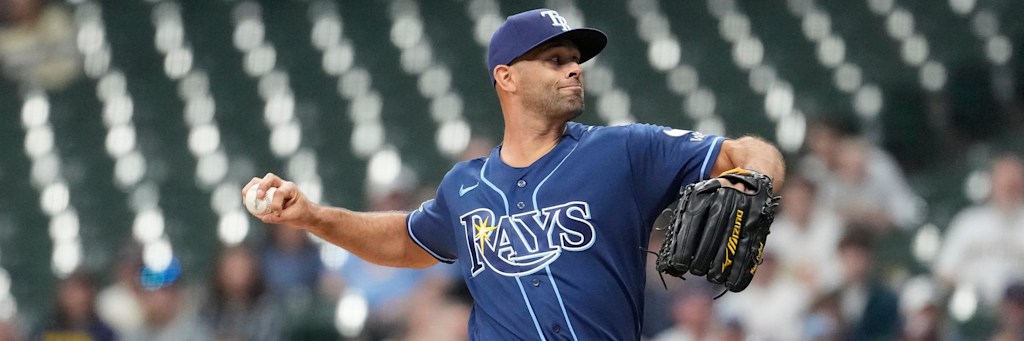
Nick Martinez is 11-3 with a 2.65 ERA and the best control mark on the slate, twenty walks in 129 innings for 1.40 per nine. He is also the lowest strikeout starter on the board at 5.09 per nine, working off a sinker at 30.8 percent and 92.5 mph and a changeup at 27.6 percent and 78.3, a fourteen mile per hour velocity separation designed to induce weak contact rather than swings and misses.
Set his rate against Paul Skenes at 11.24 strikeouts per nine. The difference is 6.15 per nine innings, which across a six inning start works out to roughly four additional batted balls put into play. Four extra balls in play is a small number in a neutral venue. Sutter Health Park is not neutral by any measurement taken here, and the Athletics hit .264/.341/.449 at home for 5.02 runs a game against .223/.294/.350 and 3.69 on the road. On July 31, Martinez allowed six earned runs and four home runs in six innings against the White Sox.
Three Home Splits Running Backward
Home-field advantage is normally treated as a constant. Measured club by club this season, it is not. Of the eight home teams involved in tonight's plays, three post a lower OPS at home than on the road, and two more are effectively flat.
| Home Club | Home OPS | Road OPS | Difference |
|---|---|---|---|
| Athletics | .790 | .644 | +.146 |
| Atlanta Braves | .763 | .702 | +.061 |
| Arizona Diamondbacks | .739 | .681 | +.058 |
| Miami Marlins | .739 | .724 | +.015 |
| Detroit Tigers | .734 | .725 | +.009 |
| Los Angeles Dodgers | .742 | .787 | -.045 |
| San Diego Padres | .672 | .723 | -.051 |
| St. Louis Cardinals | .669 | .726 | -.057 |
Two plays on the card lean on that inversion. The Phillies moneyline at -163 is a road favorite against a St. Louis club that is 30-34 at Busch and scores 3.75 runs per game there against 5.09 away from it. Cristopher Sanchez is the arm behind the price, 15-4 with a 2.65 ERA and 174 strikeouts in 149.2 innings, throwing three pitches and nothing else: sinker 43.0 percent, changeup 37.8 percent, slider 19.3 percent, with a 1.76 ground-out to air-out ratio.
San Diego's .672 home OPS is the lowest home mark of any club on the card, which is the same inversion working in favor of the Brewers and Padres under.
Where The Decomposition Argues With The Card
Arizona's team total over 4.5 has the best baseline on the board and the weakest recent evidence. The venue supplies 9.15 combined runs, Arizona scores 4.77 at home, Colorado's staff carries a 5.51 ERA and a 1.52 WHIP, and Tomoyuki Sugano has surrendered twenty-two home runs in 107.2 innings for a 1.84 per nine rate while striking out 5.10 per nine. Every structural input points up.
Down is where the game log points. Across its last ten games Arizona has scored 12, 0, 5, 4, 10, 1, 4, 1, 4 and 9. Four of ten clear 4.5. A 40 percent recent clear rate against a 58.8 percent break-even is a real gap, and while ten games is far too small a sample to overturn a season-long baseline, it is also the sample closest in time to the bet. Colorado's Mitch Bratt arrives off seven scoreless innings with nine strikeouts on August 5, which is one more piece of evidence in the uncomfortable direction.
The Guardians at plus 1.5 for -190 is the play least explained by anything measured here. Cleveland scores 3.97 runs per game, the lowest figure among the sixteen clubs on tonight's card, and hits .218/.295/.360 on the road. The argument is structural rather than offensive: Detroit's listed starter, Drew Anderson, has appeared in forty-one games and started three, and his August 5 outing ran 3.2 innings on forty-two pitches. A bullpen game shifts the run distribution toward the middle, and Detroit's relief corps has blown twenty-six saves against twenty-three converted. That ticket is buying the shape of the distribution, not its center.
What This Method Buys And What It Does Not
Venue baselines computed this way are unadjusted, contaminated by roster quality, and built on samples of fifty-seven to sixty-four games. None of the residuals above are causal estimates. What the decomposition does buy is a ranking that price alone does not reveal: the cheapest ticket on the card, at 53.5 percent break-even, is also the one needing the smallest correction from its baseline, while the second-largest stake needs nearly a full run of movement in a park that already suppresses.
Every venue figure, split, rate and game log entry in this piece was pulled live from official league statistics during this session and computed from completed 2026 regular season games only. Where a number rests on a small sample, the sample size is stated next to it.