Cardinals Prediction, August 9, 2026
When The Season Line Hides Two Different Pitchers
Published August 9, 2026 | Split-Level Decomposition | MLB Prediction Data Lab
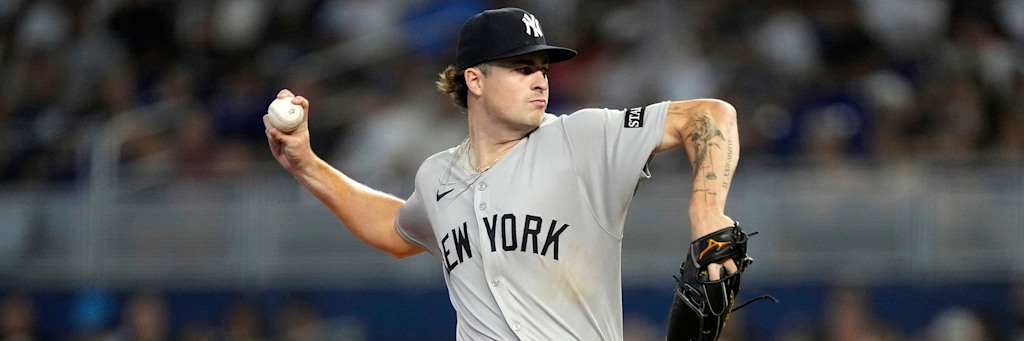
Cam Schlittler has thrown 139.2 innings this season and allowed 35 earned runs. That produces a 2.26 ERA, third best in Major League Baseball. It also describes a pitcher who does not exist. Away from Yankee Stadium he has a 1.10 ERA and a .156 opponent batting average. Inside it, a 4.32 ERA and a .269 opponent average. The season figure is the midpoint between two performances that have almost nothing to do with each other, and this afternoon he pitches at home.
The Aggregation Problem
A season rate stat is a weighted average over conditions that are never repeated in a single game. Any given start happens at one park, against one lineup, in one role. When the conditional distributions are tight, the aggregate is a fair estimator. When they separate, the aggregate becomes the least informative number available, because it is the one value the pitcher never actually produces.
Today's seven-play card is unusually good material for this, because it contains both cases in extreme form.
| Pitcher | Season ERA | Home ERA | Road ERA | Spread |
|---|---|---|---|---|
| Cam Schlittler (NYY) | 2.26 | 4.32 (50.0 IP) | 1.10 (89.2 IP) | 3.22 |
| Jacob Misiorowski (MIL) | 1.63 | 1.51 (71.1 IP) | 1.78 (55.2 IP) | 0.27 |
| Troy Melton (DET) | 1.58 | 2.10 (34.1 IP) | 1.13 (39.2 IP) | 0.97 |
| Logan Webb (SF) | 3.74 | 3.88 (65.0 IP) | 3.60 (60.0 IP) | 0.28 |
| Michael McGreevy (STL) | 3.59 | 3.28 (60.1 IP) | 3.90 (60.0 IP) | 0.62 |
The Case Where Stability Is Itself The Signal
Jacob Misiorowski is the opposite object. He leads the majors in earned run average at 1.63, in WHIP at 0.73, and in strikeouts at 195, three separate leaderboards simultaneously. What matters for a projection is that the underlying splits barely move: 1.51 at home against 1.78 on the road, with WHIP figures of 0.73 and 0.74 that are effectively identical.
A 0.27 run spread across 127 innings is close to what noise alone would produce. The estimator is stable, which means the season number can be used as a forecast rather than merely a summary. That is a meaningfully different epistemic situation than Schlittler's, even though both pitchers have excellent headline ERAs.
| Input | Misiorowski | Prielipp (MIN) |
|---|---|---|
| ERA | 1.63 | 4.75 |
| WHIP | 0.73 | 1.31 |
| Opponent average | .145 | .246 |
| Strikeouts | 195 in 127.0 IP | 81 in 77.2 IP |
Where This Card Contradicts Our Own Projection
Honesty requires leading with the disagreement rather than burying it. The Rockies-Cardinals over 9 at -120 is on the card. Our Atlas team-total model projects St. Louis at 3.92 runs and leans to the St. Louis under 4.5. That is a direct argument against this total, produced by our own system.
The split data makes the tension worse, not better. Colorado away from Coors Field scores 4.45 runs per game on a .706 OPS. St. Louis at Busch Stadium scores 3.68 runs per game on a .663 OPS, a home figure far below its own .726 road OPS. Adding the two conditional rates gives roughly 8.13 expected runs. The total is 9.
| Component | Relevant Split | Runs Per Game |
|---|---|---|
| Colorado offense | Road, .706 OPS | 4.45 |
| St. Louis offense | Home, .663 OPS | 3.68 |
| Combined expectation | Sum of conditionals | 8.13 |
| Posted total | Over 9 at -120 | 9.0 |
So the over is not an offense play. It is a single-pitcher fade, and it stands or falls on Michael Lorenzen. His season line is a 6.94 ERA, a 1.85 WHIP and a .336 opponent batting average, the worst of any starter on this card by a distance. His three most recent starts produced six earned runs across 3.2 innings, three across four innings, and seven across three innings. The bet is that Colorado's bullpen inherits the game early and the run environment stops resembling either team's season rate.
The Sample Size Column Nobody Prints
Two arms on this card sit below the innings threshold that qualifies a pitcher for a rate-stat leaderboard, which is one inning per team game, or 117 innings at this point in the schedule.
Troy Melton has a 1.58 ERA and a 0.91 WHIP across 74 innings and twelve starts. That is excellent and it is also 43 innings short of qualification. His road mark of 1.13 across 39.2 innings, which is the relevant split for a start at Oracle Park, rests on a sample where a single poor outing would move the figure by more than half a run.
Erik Miller is the sharper illustration. He has made forty appearances this season and started none of them. Thirty-eight came for San Francisco, where he compiled the 2.76 ERA that is usually printed beside his name. Two came for Boston, totalling 2.1 innings. Any projection that treats him as a starter is extrapolating from zero observations of the thing being projected.
| Play | Price | Units | Implied Break-Even |
|---|---|---|---|
| Rockies/Cardinals Over 9 | -120 | 1.0 | 54.5% |
| Dodgers Moneyline | -139 | 1.5 | 58.2% |
| Red Sox Moneyline | -230 | 3.0 | 69.7% |
| Yankees Moneyline | -137 | 1.5 | 57.8% |
| Tigers Team Total Under 3.5 | +105 | 1.0 | 48.8% |
| Tigers/Giants Under 7.5 | -120 | 2.0 | 54.5% |
| Brewers Run Line -1 | -198 | 3.0 | 66.4% |
The Two Plays The Splits Actively Support
Los Angeles at -139 is the cleanest conditional read on the board. The Dodgers score 5.59 runs per game on the road with a .791 road OPS, both the highest such figures among the twelve teams in action, and Justin Wrobleski is 11-3 with a 3.31 ERA and a 1.07 WHIP. Arizona's Eduardo Rodriguez counters at 2.71 across 136.1 innings, which caps how far the edge can extend.
Boston at -230 draws support from a split rather than from its starter. The Athletics score 5.00 runs per game at home and 3.68 on the road, with the road OPS falling to .643. That is a 1.32 run swing purely by venue, the largest offensive home-road gap on the card, and it is the mechanism behind a price that the pitching matchup alone cannot justify.
Where The Decomposition Fails
Splitting a season into conditions buys resolution and pays for it in sample size. Schlittler's 4.32 home ERA rests on 50 innings, which is enough to notice and not enough to be certain about. Park effects, opponent quality and scheduling all contaminate a raw home-road cut, and none of those confounders are controlled for in the figures above.
The Detroit team total under 3.5 shows the limit clearly. The Tigers score 4.65 runs per game on the road, slightly more than their 4.51 at home, so the venue split argues mildly against the play. What supports it is Logan Webb's 1.11 WHIP and the nine home runs he has allowed across 125 innings, plus a San Francisco run environment that has held its own hosts to 4.09 runs per game. Two of those three inputs describe the pitcher and the park rather than Detroit's bats, which is a weaker chain of reasoning than the Milwaukee ticket rests on.
Every rate, split, record and innings figure in this piece was pulled live from official statistics during this session, and each pitcher's team splits were checked individually so that no number is attributed to the wrong club. The Atlas team-total projection is reported exactly as the system produced it, including where it disagrees with the card.