Four Prices, One Shared Variable
Published August 6, 2026 | Break-Even Decomposition | MLB Prediction Data Lab
Four separate betting markets, spread across three unrelated games, do not usually share a single explanatory variable. Tonight's card does. Every one of the four prices, the Nationals team total, the Tigers-Mariners game total, the Tigers team total, and the Boston moneyline, is elevated or suppressed primarily by one pitcher's strikeout rate relative to the hitters standing across from him. That pattern is worth documenting on its own, independent of whether any individual play clears its break-even threshold.
Input One: A 10.5 K/9 Rate Against A 5.3 Runs-Per-Game Offense
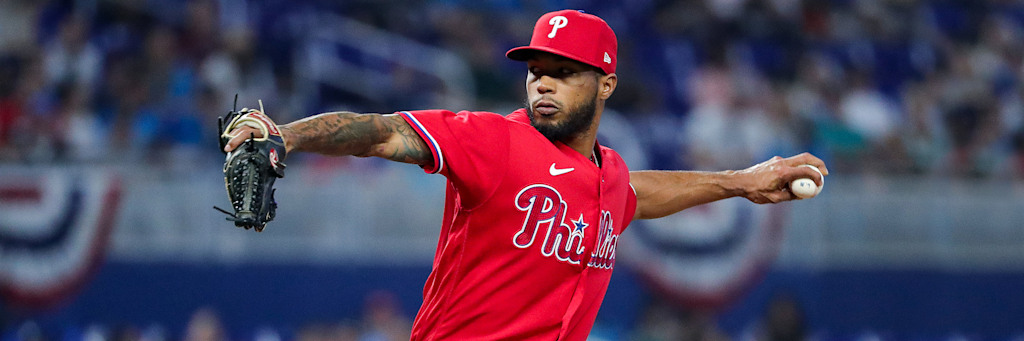
Washington is averaging 5.3 runs a game across 116 games this season on a .250 team batting average and a .766 OPS, a lineup fronted by James Wood at .271/.396/.557 with 30 home runs, 72 runs batted in and 96 runs scored, and CJ Abrams at .290 with 122 hits and 88 runs batted in. That is the population average. Tonight's specific game is not drawn from the population average, because Philadelphia starts Cristopher Sanchez, and Sanchez's strikeout rate of 10.5 per nine sits well clear of the league's typical starter.
| Input | Value | Effect On Team Total |
|---|---|---|
| Washington season R/G | 5.3 | Baseline, unconditioned on opponent |
| Sanchez ERA | 2.61 (14-4, 144.2 IP) | Suppresses expected runs directly |
| Sanchez K/9 | 10.5 (168 K) | Removes balls in play, the primary run-scoring mechanism |
| Sanchez WHIP | 1.20 | Limits baserunner volume even on contact |
The board's main team total sits at 2.5. This card takes the alternate line at 3.5, priced at -150, because a full run of separation between the board's default number and the conditioned expectation is a defensible gap to sell, not because the lower number is wrong on its face. A team total set at 2.5 against a 2.61 ERA strikeout pitcher is arguably the sharper number; the trade being made here is accepting a shorter number by buying half a run of room in exchange for a materially higher hit rate.
Input Two: The Same Mechanism, Applied Twice, In One Building
Detroit and Seattle generate two tickets from a single mechanism working in the same direction. Bryce Miller's 2.80 ERA is the lowest of any starter appearing across the entire three-game featured slate, and it sits inside a Seattle pitching staff carrying a 3.71 team ERA, a 1.18 WHIP and 3.82 runs allowed per game, the strongest run-prevention unit in either dugout of any game examined here. Detroit's offense averages 4.5 runs a game this season on a .242 team average and a .729 OPS, already a below-average offensive unit before adjusting for the pitcher in front of it.
| Team | Season R/G | OPS | Opposing Starter ERA |
|---|---|---|---|
| Detroit (road) | 4.5 | .729 | 2.80 (Miller) |
| Seattle (home) | 4.04 | .689 | 4.41 (Valdez) |
Framber Valdez's 4.41 ERA does not carry the same weight as Miller's number, and Seattle's own offense at 4.04 runs a game and a .689 OPS is unremarkable. The case for the game total under 7 rests less on Valdez individually and more on the full-staff comparison: Seattle's pitching is meaningfully better than Detroit's offense across the board, and T-Mobile Park's dimensions, 331 feet down the left field line, 401 to dead center, 326 down the right field line, plus the marine layer that regularly affects evening flight in Pacific Northwest ballparks, do not counteract that gap.
Input Three: A Decline Curve Measured Against A Stable One
The fourth play departs from the strikeout-rate pattern and instead compares two earned run average trajectories. Ranger Suarez sits at 3.15 with 105 strikeouts and a 1.16 WHIP across his 2026 season, a stable performance level maintained across a full four-plus months of starts. Luis Castillo is 3-9 with a 5.06 ERA and a 1.39 WHIP across 99.2 innings, all of it compiled during 20 starts with Seattle between March 30 and July 28. He has made zero starts for Chicago; tonight at Fenway is his first appearance in a White Sox uniform since the trade.
| Pitcher | Record | ERA | WHIP | Team Record |
|---|---|---|---|---|
| Ranger Suarez (BOS) | 4-3 | 3.15 | 1.16 | 62-51 |
| Luis Castillo (20 GS with SEA) | 3-9 | 5.06 | 1.39 | 59-54 |
A 1.91 earned run average gap between the two starters is the single widest pitching differential of any game on tonight's slate. Fenway Park's Green Monster, 37 feet high and 310 feet from home plate down the left field line, converts fly balls into doubles at a rate that a deeper, more experienced lineup tends to exploit more consistently than a roster still adjusting to a new home ballpark environment, which describes Castillo more than it describes the Boston hitters he is facing.
What The Engine Actually Says Tonight
An honest accounting of this card requires stating what the site's own projection engine produced for tonight's slate, independent of the four plays above. Its team-level run projections are Washington 4.46, Philadelphia 5.02, Detroit 4.67, Seattle 3.65, Boston 4.49 and Chicago 5.09. Its single actionable signal across the full eleven-game schedule is a Phillies team total under 5.5 at -118, sized at a half unit, and that play is not part of this card at all.
The engine is not backing the Nationals under, the Tigers plays, or the Boston moneyline. Every play above was built by hand from pitcher-level rate stats, team-level averages and physical park data pulled this session, not generated by the automated projection system. Readers should weigh that distinction directly: a matchup-level analytical case is being made using the same category of inputs the engine uses, but the engine's own aggregate view of tonight's six teams does not independently confirm any of these four prices.
Where The Case Is Weakest
Four honest counterpoints, one per play. James Wood is a 30 home run hitter and requires only one mistake to beat a team total by himself; Sanchez has allowed home runs this season, and the alternate line's extra half run of cushion evaporates on a single solo shot. Valdez's 4.41 ERA has produced worse starts than that number suggests on a given night, and Detroit's offense, mediocre as its season average is, has scored three or more runs against comparable arms before. The two Detroit-Seattle tickets share that same failure mode, which is the correlation risk stated above rather than two independent chances to be right. And Castillo's 99.2 innings and 5.06 ERA this season were compiled entirely with Seattle across 20 starts; tonight is his first appearance for Chicago, and a pitcher's debut in a new uniform is exactly the kind of data point his season rate stats cannot capture, particularly if Boston's bullpen, not examined in this piece, is forced into extended work behind a short Suarez outing.
Every rate stat, ERA, WHIP, strikeout total, walk total, runs-per-game figure, team record and ballpark dimension in this piece was pulled from live statistics sources during this session and cross-checked against the official schedule and probable pitcher assignments before publication. The engine's team-run projections and its one flagged signal are reported exactly as the system produced them, without adjustment.