MLB Picks, August 4, 2026 | Team total over
The Smallest Sample Owns The Best ERA On The Board
Published August 4, 2026 | Rate Stabilization Model | MLB Prediction Data Lab
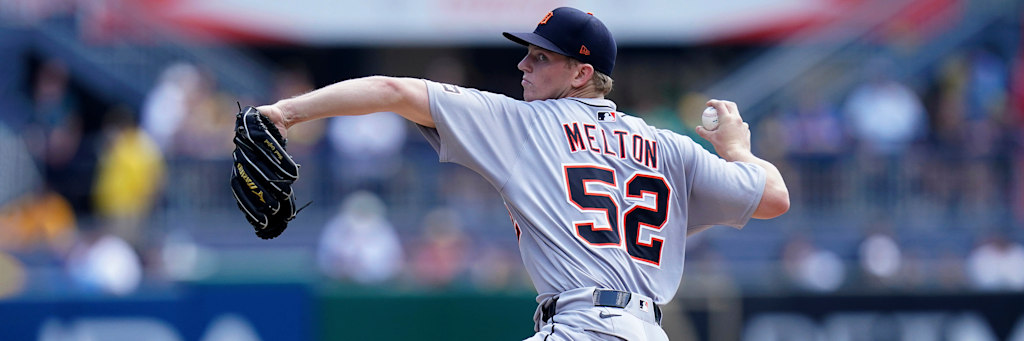
Troy Melton has a 1.75 ERA. Emerson Hancock has a 3.26. They face each other in Seattle tonight, and the pitcher with the worse ERA has the better strikeout rate, the better walk rate, 43 more innings of evidence and almost exactly the same home run rate. Every bit of that 1.51 run gap traces to one number, and it happens to be the number a pitching model trusts least.
The Order In Which Pitching Rates Become Real
A season is not one sample. It is a stack of them, and they mature at different speeds. Strikeout rate settles first, because a strikeout is a completed event that involves nobody but the pitcher, the catcher and the umpire. Walk rate settles next for the same reason. Home run rate takes considerably longer, because a home run is a batted ball and batted balls are shared with a defense, a park and a wind direction. Opponent batting average settles last of all, because it is almost entirely made of batted balls that stayed in play.
The practical consequence is that two pitchers with identical ERAs can carry wildly different amounts of information. Rank tonight's six starters by ERA and you get one board. Rank them by the components that have actually stabilized and the board reorders.
| Starter | GS | IP | ERA | K/9 | BB/9 | K/BB | HR/9 | Opp AVG |
|---|---|---|---|---|---|---|---|---|
| Tarik Skubal | 16 | 96.2 | 2.79 | 10.80 | 1.30 | 8.29 | 0.93 | .210 |
| Emerson Hancock | 20 | 110.1 | 3.26 | 8.32 | 2.20 | 3.78 | 1.14 | .217 |
| Troy Melton | 11 | 67.0 | 1.75 | 8.06 | 2.82 | 2.86 | 1.07 | .174 |
| Javier Assad | 9 | 69.2 | 3.75 | 6.20 | 2.33 | 2.67 | 1.55 | .243 |
| J.T. Ginn | 19 | 109.1 | 3.46 | 8.23 | 4.03 | 2.04 | 1.07 | .211 |
| Brady Singer | 21 | 107.2 | 4.68 | 7.61 | 3.01 | 2.53 | 1.76 | .273 |
Seattle: The Cleanest Case The Model Will See This Week
Put Melton and Hancock side by side one column at a time. Strikeouts per nine: 8.06 against 8.32, advantage Hancock. Walks per nine: 2.82 against 2.20, advantage Hancock. Home runs per nine: 1.07 against 1.14, a difference of seven hundredths of a run across a full season, which is noise. On the three components that stabilize fastest, the pitcher with the higher ERA is even or ahead on all three.
The gap lives entirely in opponent batting average, .174 against .217. Forty three points of contact suppression on a 67 inning sample is the definition of a number that has not finished moving.
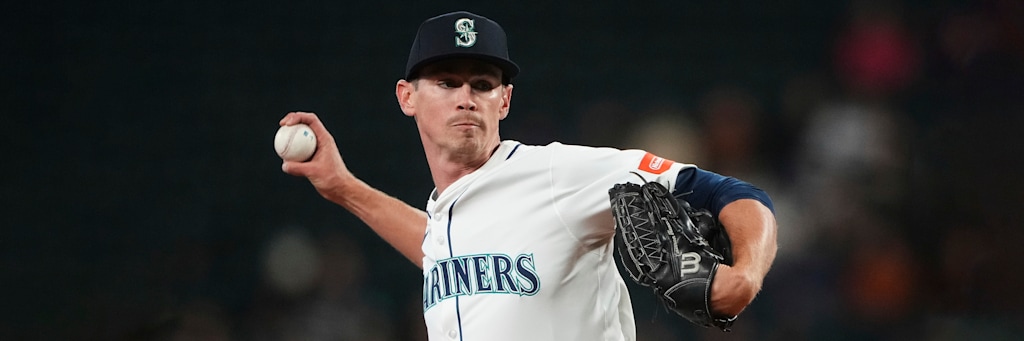
The venue term compounds it. T-Mobile Park measures 390 feet to left center and 387 to right center, and Seattle is 32-24 inside it against 23-34 everywhere else. Detroit is 24-31 on the road, 12-20 in one run games and 3-7 in extra innings, a profile that says the Tigers convert close late games into losses at a rate no model would project forward but every model would flag as a risk marker.
Melton's own logs show the seams. He walked four batters on July 17 at Anaheim and four again on July 23 against Kansas City. On June 9 against Minnesota he gave up four home runs in five innings, half his season total in a single afternoon. He also threw seven shutout innings against Baltimore on July 28, so this is a real pitcher with a real arsenal: a four seamer at 96.3 mph, a cutter at 92.2, a slider at 86.6 and a splitter at 88.8.
The counterpoint is severe and it belongs in the open. Seattle ranks 28th in baseball at 4.02 runs per game, and playing at home does not fix it: 226 runs in 56 home dates, a rate of 4.04. Randy Arozarena at an .834 OPS and Dominic Canzone at .848 are the only two regular bats above .800. Backing this club is a run prevention argument and a geometry argument. It is not an offensive one, which is exactly why the stake is one unit and not three.
Chicago: When The Fast Rates Are The Entire Edge
Skubal is the opposite kind of profile from Melton, and the table shows why. His 10.80 strikeouts and 1.30 walks per nine produce a ratio of 8.29, the highest on the board by more than four full points. Both of those inputs are the fast-stabilizing kind. Seven of his sixteen starts have finished with zero walks. His .210 opponent average is nearly identical to Ginn's .211, which means the contact-suppression term is doing almost none of the work in his ERA.
All sixteen of those starts were thrown in a Detroit uniform. Tonight he takes the ball for Los Angeles at Wrigley Field.
Assad sits at the other pole. His 1.16 WHIP looks excellent until it is paired with a 6.20 strikeout rate, the lowest of any starter working tonight. A low WHIP built without strikeouts is a contact-dependent WHIP, and contact-dependent results are the ones a model discounts hardest. His 1.55 home runs per nine is the second highest number in the table.
Workload is the sharper input. Assad has not recorded eighteen outs in a game since June 12. The eight appearances since then read 5.2, 5.0, 2.2, 4.2, 5.0, 1.0, 3.0 and 4.1 innings. Against the third best offense in baseball, that hands twelve to fifteen outs to a Chicago bullpen attached to a staff that has allowed 168 home runs across 1008.2 innings.
Los Angeles is also the correct side of a split most models underweight. The Dodgers have scored 329 runs in 57 road games, 5.77 per game, batting .273 with an .800 OPS away from home, against 248 runs in 56 home games and a .740 OPS. Shohei Ohtani carries a .940 OPS with 67 walks and Freddie Freeman is hitting .309.
Here is the honest side of that. Chicago has the second best offense in the sport at 5.13 runs per game, scored 286 runs in 56 games at Wrigley Field, and is 32-24 there. Pete Crow-Armstrong is at a .919 OPS with 24 home runs and 26 steals, and Seiya Suzuki is at .846. The Cubs beat this same Dodgers club 10-5 in this park last night, Los Angeles has lost four in a row, and the bullpen rest gap runs the wrong way: eleven Dodgers relief innings over the last three days against eight for Chicago. A 64.8 percent requirement is a lot to ask of a road favorite that just lost by five.
Cincinnati: The Largest Sample On The Card Belongs To A Bullpen
Team totals decompose differently from moneylines. The inputs are the opposing starter, the opposing relief corps, the park and the lineup, and the second of those carries by far the most innings. The Athletics staff has thrown 995.1 innings this season at a 5.42 ERA with a 1.50 WHIP and 176 home runs allowed, a rate of 1.59 per nine. That is roughly nine times the sample behind any individual starter in the table above, and it is the most trustworthy number on the entire card.
Ginn is the good part of that staff and he still hands the ball over early. His 4.03 walks per nine is the highest mark in the table and his 2.04 strikeout to walk ratio is the lowest. On July 1 he needed 104 pitches to get eighteen outs against the Dodgers, walking five men in a start he otherwise dominated. Cincinnati's task is not to beat him. It is to reach the sixth inning within striking distance and then face the 5.42.
Great American Ball Park supplies the rest. The right field line runs 325 feet and right center 370, and the Reds have hit 79 of their 145 home runs at home across 57 dates. Elly De La Cruz is slugging .500 with 20 stolen bases, Sal Stewart has 24 home runs and 85 runs batted in, and JJ Bleday has drawn 50 walks in 295 at bats, which is the profile that punishes a 4.03 walk rate.
The counterpoint on this one is the harshest of the three. Cincinnati averages 4.16 runs per game, 24th in baseball, and the total asks that offense to clear 4.5 against a starter with a 3.46 ERA and a .211 opponent average. The home split offers no help either: 231 runs in 57 home games against 231 in 54 road games. The park inflates home runs and it does not inflate this team's run scoring. Brady Singer, meanwhile, is the weakest starter in the table by ERA, WHIP, home run rate and opponent average all at once, which is why the moneyline half of the Cincinnati exposure is the smaller stake.
What The Card Requires
Four tickets and 7.5 units, with break-even thresholds of 53.5, 56.3, 64.8 and 54.1 percent. The two smallest requirements sit on the same game and rise and fall together. The largest requirement carries the largest stake, which inverts the usual staking logic and should be understood as a deliberate choice rather than an oversight: the Los Angeles edge is concentrated in the two fastest-stabilizing rates in the sport, and the model weights those more heavily than it weights a one game result or a four game skid.
Every record, innings total, earned run average, walk rate, strikeout rate, home run count, opponent batting average, pitch usage percentage, average velocity, bullpen appearance and outfield dimension in this breakdown was pulled from live league statistics feeds during this session. Ratios, per nine rates, per game rates and break-even percentages are computed from those pulled inputs rather than quoted from a secondary source.