Athletics Prediction, August 5, 2026 | Team total under
Two Offenses Wearing The Same Uniform
Published August 5, 2026 | Bimodal Distribution Model | MLB Prediction Data Lab
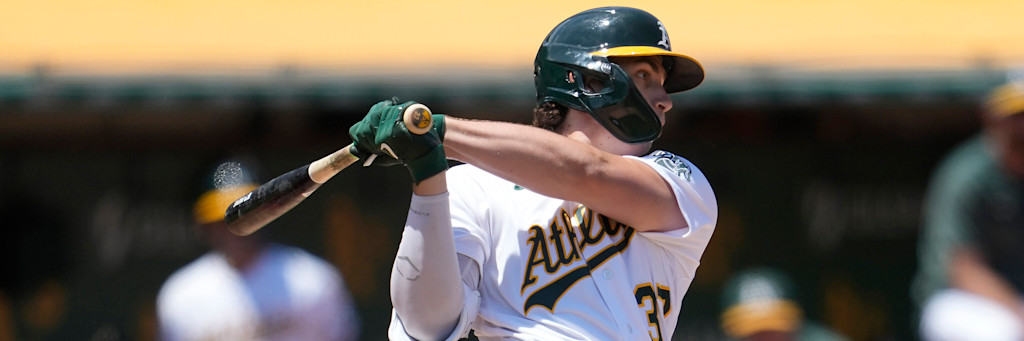
The Athletics have scored 491 runs in 113 games, an average of 4.35, which places them 20th in baseball and reads as thoroughly ordinary. That number describes no game they have actually played. At home they average 5.00 runs across 57 dates. On the road they average 3.68 across 56. The season figure is the midpoint of two populations that barely touch each other, and tonight only one of them boards a plane to Cincinnati.
When The Average Sits In The Valley
A mean is a useful summary when observations cluster around it. It becomes actively misleading when the observations cluster in two places and the mean lands in the empty space between them. Oakland's season splits are close to that pathology, and the gap is not confined to run scoring. It shows up in every rate the offense produces.
| Split | Games | Runs | R/G | AVG | OPS | HR |
|---|---|---|---|---|---|---|
| Athletics at home | 57 | 285 | 5.00 | .264 | .790 | 83 |
| Athletics on the road | 56 | 206 | 3.68 | .226 | .649 | 51 |
| Athletics overall | 113 | 491 | 4.35 | .245 | .720 | 134 |
One hundred and forty one points of on base plus slugging separate the two halves. Thirty two home runs separate them across a near identical number of games. A .790 road OPS would rank this offense comfortably above average; a .649 would place it among the worst in the sport. Both belong to the same 26 men.
Sample size deserves a hearing before anything is built on this. Fifty six road games is not a fluke window, it is more than a third of a season, and the split has not been drifting toward the mean as the games accumulate. That matters more than the size of the gap itself, because a gap that closes over time is noise and a gap that persists is structure.
Counting Games Instead Of Averaging Them
A team total is not settled by an average. It is settled by which side of a threshold a single game lands on, so the correct object to examine is the distribution, not its center. Sorting all 56 Oakland road games by runs scored produces the following.
| Runs scored on the road | Games | Share of 56 |
|---|---|---|
| Zero | 4 | 7.1% |
| One | 14 | 25.0% |
| Two | 8 | 14.3% |
| Three | 6 | 10.7% |
| Four | 4 | 7.1% |
| Four or fewer, cumulative | 36 | 64.3% |
| Five or more | 20 | 35.7% |
Fourteen road games at exactly one run is the single most common outcome in the entire set, and thirty two of the 56 finished at three runs or fewer. The under at 4.5 needs the game to land in the top block of that table, which has happened 64.3 percent of the time.
Run the identical count on the home schedule and 29 of 57 games cleared five runs, a rate of 50.9 percent. The same threshold, the same roster, a fifteen point swing in frequency depending on the postal code.
The Pitching Term Points The Same Direction
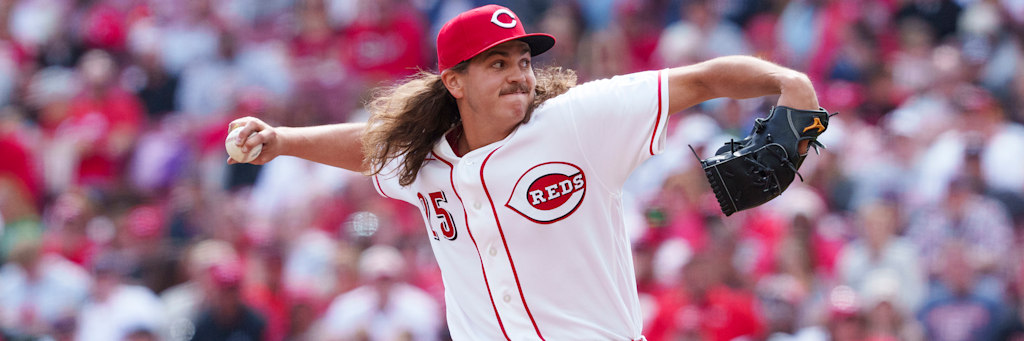
Rhett Lowder has a 5.42 earned run average across 83 innings, which is a bad season number and an honest one. It is also, like the Oakland offense, a blend of two things. At Great American Ball Park he has made six starts covering 41 innings with a 3.07 earned run average, a 1.20 WHIP, 36 strikeouts against 12 walks and a .234 opponent batting average. Away from it he has made ten starts covering 42 innings with a 7.71 earned run average, a 1.83 WHIP, 25 walks and a .299 opponent average.
Forty one innings against forty two. There is almost no sample-size argument available to dismiss one side in favor of the other, which is unusual and makes the split unusually usable. His worst outings of the season are all road entries: one and a third innings at Pittsburgh on May 2, two and a third innings at Colorado on July 18 during which he gave up eleven hits and eight earned runs. His most recent home start, July 30 against Pittsburgh, ran six innings on 90 pitches with five hits, two earned runs, five strikeouts and zero walks.
The arsenal is a four pitch spread with no dominant offering: a sinker 29.9 percent of the time at 92.7 miles per hour, a slider 27.6 percent at 84.9, a four seam fastball 21.4 percent at 93.4 and a changeup 20.0 percent at 86.3. That shape produces contact rather than swings and misses, and contact-oriented pitchers are precisely the ones whose results swing hardest on the quality of the offense in front of them.
Behind Lowder sits a Cincinnati relief corps that has thrown 420 innings at a 4.46 earned run average with a .235 opponent batting average. That contact-suppression figure is the lowest of the four staffs involved in tonight's two Ohio Valley storylines, and it means the late innings do not offer Oakland the soft landing that a bullpen bridge often provides.
Where The Model Finds Nothing
An honest breakdown reports the terms that came back empty. Oakland's platoon split is one of them. The Athletics hit .248 with a .409 slugging percentage and a .720 OPS against left-handed pitching, and .244 with a .396 slugging percentage and a .721 OPS against right-handers. Those are the same number. Lowder throws right-handed, and that fact contributes exactly zero to the projection.
Park geometry is a second empty term, and it leans slightly the wrong way. Great American Ball Park measures 328 feet down the left field line, 379 to left center, 404 to center, 370 to right center and 325 down the right field line. That right side is short, the roof is open, and Oakland has hit 134 home runs this season. A team total under in a home run park carries a specific tail risk that no rate statistic captures: one swing changes a 3 to a 6.
The Counterpoint, Stated Properly
Start with last night. These same two clubs played at this same ballpark on August 4, and Oakland scored four runs in a 5-4 loss. The under would have won by half a run, which is another way of saying the market's number is drawn very close to the correct place and this is not a wide edge.
Second, Lowder's season line remains a 5.42 earned run average and a 1.52 WHIP. Backing a home split against a bad aggregate is a defensible model choice and a genuinely uncomfortable one. If the 41 inning home sample is the illusion and the 83 inning total is the truth, this position is on the wrong side of the argument entirely.
Third, twenty of Oakland's 56 road games did clear five runs, including a fourteen run afternoon. The 64.3 percent base rate leaves better than one game in three where this ticket loses, and the losses will not always be close ones.
Fourth, form cuts against the play in a subtle way. Oakland has lost six straight and won once in its last nine, and clubs in that state are often sold too cheaply by the market precisely because everyone can see the streak. The A's did score four last night while losing, so the bats are not silent.
What The Position Requires
Two units at -120 needs 54.5 percent. The venue-conditioned base rate is 64.3 percent, the opposing starter has been a 3.07 pitcher in this building across 41 innings, and the relief corps behind him holds opponents to a .235 average. Against that sit a short right field, a 134 home run offense and a season-long pitcher line that does not support the home split.
The whole position reduces to one methodological claim: when a distribution has two clear modes and the game in question belongs unambiguously to one of them, the correct input is that mode and not the average of both. Oakland is playing in Cincinnati tonight. The 3.68 population is the one taking batting practice.
Every record, split, inning total, earned run average, walk count, opponent batting average, pitch usage percentage, average velocity and outfield dimension in this breakdown was pulled from live league statistics feeds during this session. The run distribution tables were built by counting completed game results one at a time and were reconciled against the official home and away split totals before publication. Ratios, per game rates and break-even percentages are computed from those pulled inputs.