MLB Picks, July 22, 2026 | Guardians moneyline
Venue Split Model: Four July 22 Prices Where The Season ERA Hides Two Different Pitchers
Published July 22, 2026 | Daily Model Breakdown | MLB Prediction Data Lab
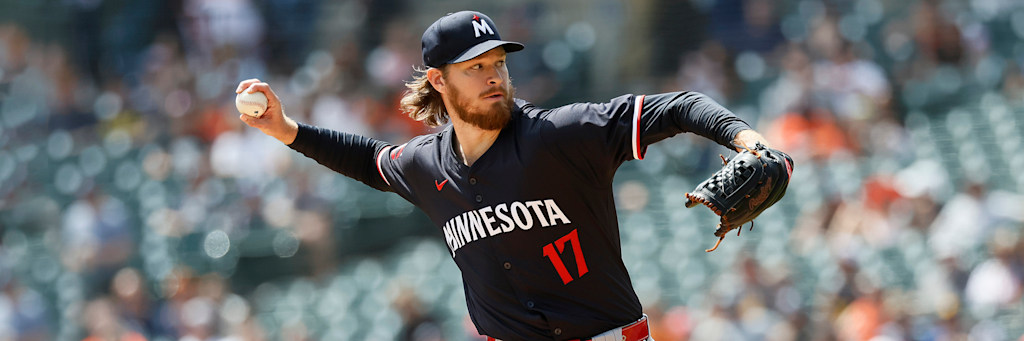
On May 12 at Target Field, Bailey Ober threw nine shutout innings against Miami with seven strikeouts. Eighteen days later, away from home, he gave up twelve hits and seven earned runs in 4.2 innings to Pittsburgh. The scoreboard graphic that will appear behind him tonight reads 4.32, and that number describes neither of those pitchers. It is the arithmetic midpoint of two performance distributions that barely overlap, and a model that treats it as a single parameter is discarding the most stable predictive signal available on this board.
The Framework: Splitting The Blend Before Projecting Runs
A season ERA is a weighted average across environments. Park dimensions, mound feel, umpire assignment, travel state and platoon deployment all vary by venue, and for some pitchers those variations are noise while for others they are the dominant term. The model's first pass on any starter is a variance test: it compares home and road run-prevention rates and asks whether the difference exceeds what the innings totals would produce by chance.
When the answer is no, the blended rate stands. When the answer is yes, the model discards the blend entirely and projects the game using only the venue-appropriate half, then applies a shrinkage penalty proportional to how thin that half is. Four of tonight's five relevant starters clear the variance threshold, and in three of the four cases the market price appears to be anchored on the blended figure.
| Starter | Home ERA | Home IP | Road ERA | Road IP | Tonight |
|---|---|---|---|---|---|
| Bailey Ober (MIN) | 2.68 | 47.0 | 6.90 | 30.0 | Road |
| Sandy Alcantara (MIA) | 3.26 | 66.1 | 4.48 | 70.1 | Road |
| Griffin Jax (TB) | 3.68 | 36.2 | 4.46 | 38.1 | Road |
| Slade Cecconi (CLE) | 4.08 | 35.1 | 4.81 | 63.2 | Home |
| Peter Lambert (HOU) | 3.17 | 59.2 | 2.78 | 32.1 | Home |
Lambert is the control case. His split runs the wrong direction and the gap is under half a run, so the model treats his 3.03 season figure as reliable and moves on. Ober is the opposite extreme, a 4.22-run spread in which the road half also carries a .303 opponent batting average against a .195 mark at home, and eight home runs allowed in thirty road innings against five in forty-seven at home. Two hitting profiles, one pitcher, one line on the scoreboard.
Game One: Twins At Guardians, Cleveland -137
The price demands a 57.8 percent win probability. The venue-split model produces 61.4 percent, and almost the entire margin comes from replacing Ober's blended 4.32 with his road 6.90 and then shrinking it back toward league average for sample size, which lands the projection at an expected 4.9 runs allowed over five innings of work.
Two structural facts support that shrinkage rather than fighting it. Ober was placed on the injured list on May 31 with right elbow inflammation and activated on July 9, meaning tonight is his third appearance back and his workload has been capped at 5.0 and 5.1 innings in the first two. His repertoire also depends on a narrow speed band: a changeup thrown 36.1 percent of the time at 82.9 mph off an 88.4 mph four-seamer, roughly five and a half miles of separation, which is the kind of pairing that degrades fast when fastball velocity slips even slightly.
Cleveland's own starter contributes almost nothing to the edge. Slade Cecconi carries a 4.55 season ERA and a 1.41 WHIP, and his last outing against these Twins on July 8 ended after 3.2 innings. What the model does credit is the staff behind him, a 3.73 team ERA against Minnesota's 4.75, and a bullpen that threw only 53 pitches in relief on Tuesday because Parker Messick worked 5.2 innings in a 5-2 win.
The counterweight is offensive. Cleveland scores 4.02 runs per game, the second lowest figure in the major leagues, on a .233 team average and 410 runs in 102 games. Minnesota has scored 485. A model that leans this hard on run prevention is accepting that the Guardians will not score their way out of a bad start, which caps the stake below two units regardless of how attractive the pitching input looks.
Game Two: Rays At Blue Jays, Tampa Bay +106
This is the only game on the card where the starting pitcher input is essentially undefined for one side, and the reason is a roster construction choice rather than an injury. Toronto's listed starter, Braydon Fisher, has made 47 appearances covering 49.1 innings. Six of those are officially starts and the longest ran 1.1 innings. He threw 0.2 innings on July 17, 0.2 on July 19 and 1.0 on July 20. The model classifies him as an opener and projects innings two through nine from the bullpen distribution instead.
That distribution is currently degraded. In Tuesday's 12-2 loss Kevin Gausman was removed after 3.1 innings and 90 pitches, which forced Lazaro Estrada to throw 41 pitches and Patrick Corbin 48, and the ninth inning went to Myles Straw, a position player. Roughly 115 relief pitches came out of that staff in a game that was decided by the fifth.
Against that, the Rays are 58-42 with the best record in the American League East, they have won seven of nine meetings with Toronto this season, and Toronto scores 3.96 runs per game, the lowest figure in the major leagues, on a .242 average. A plus price on the stronger roster against a bullpen game is a pricing artifact of the starting pitcher field being populated by a name rather than a projection.
The stake stays at one unit because of a second split the model refuses to ignore. Tampa Bay is 35-15 at home and 23-27 on the road, a 24-point winning percentage inversion sustained across a full season, and Griffin Jax carries his own venue penalty at 4.46 on the road with a .290 opponent average away from home. He struck out ten Yankees across five innings on July 6 and allowed seven earned runs across five innings to Boston on July 17. His outing length has never exceeded six innings in fifteen starts, which means both bullpens are in play early.
Game Three: Pirates At Yankees, New York -170, Nightcap Only
Specify the game before anything else, because the model's projection applies to exactly one of the two played today. The position is Game 2 of the doubleheader at 7:05pm Eastern. Game 1 began at 1:05pm and finished as a 5-3 Pittsburgh win in ten innings, with Gerrit Cole throwing seven innings for New York. That result is already settled and is not part of this projection.
The doubleheader itself is the product of Tuesday's rain in the Bronx, which postponed the Pirates and Yankees and also wiped out Baltimore at Boston, creating the second twin bill on today's schedule. The schedule disruption is what routed a Max Fried start into the nightcap. New York placed him on the injured list on May 16 retroactive to May 14 with a left elbow bone bruise, sent him to Scranton/Wilkes-Barre on a rehab assignment on July 17, and activated him this morning.
Fried's pre-injury sample is small at 61.2 innings but exceptionally clean: a 3.21 ERA, a 1.01 WHIP, a .199 opponent average and exactly one home run allowed all season. His arsenal is unusually flat by design, a cutter at 22.4 percent and 92 mph, a sinker at 22.1 percent and 93.1, a four-seamer at 16.8 percent and 94.7, and a 73.9 mph curveball at 14.2 percent, a range of nearly 21 mph inside a single at-bat with no pitch above a quarter of his usage.
| Input | New York | Pittsburgh |
|---|---|---|
| Team ERA | 3.42 | 4.28 |
| Runs per game | 4.73 | 5.32 |
| Starter walks per nine | 2.77 | 5.25 |
| Starter home runs allowed | 1 in 61.2 IP | 10 in 94.1 IP |
| Relief pitches thrown in Game 1 | 70 | 85 |
Bubba Chandler is the model's largest negative input for Pittsburgh. Fifty-five walks in 94.1 innings is a 5.25 rate, the highest of any starter on today's schedule, and his last completed sixth inning came on June 30. He went 4.0 innings against Washington on July 5 and 4.2 against Milwaukee on July 11. Pittsburgh also spent Carmen Mlodzinski for 50 pitches in the opener, plus Mason Montgomery and Gregory Soto, so the relief innings behind a short start are thinner than the season depth chart suggests.
The honest limitation is the innings cap. A starter activated the morning of his assignment is not projected past five innings, which hands roughly four innings to a bullpen that already threw 70 pitches today. Pittsburgh has scored 543 runs, second most in baseball at 5.32 per game, and has now taken three of four from New York this season. The Yankees are also 25-23 at home against 31-22 on the road, their own venue split running the unhelpful direction. The model still clears the bar, but this is the thinnest margin of the four on a per-unit basis.
Game Four: Marlins At Astros, Under 8
Totals reward projection stability more than they reward talent, and this is the most stable pitching matchup on the board. Sandy Alcantara has thrown 136.2 innings, the largest workload of any starter working tonight, walks 2.44 per nine, and has completed at least six innings in each of his last three turns: 8.0 against the Athletics on July 4, 7.0 against Cleveland on July 10, and 6.0 against Milwaukee on July 17. He works off a sinker thrown 25.5 percent of the time at 97.4 mph paired with a changeup at 91.0.
Peter Lambert supplies the other half at a 3.03 ERA and a .197 opponent average, with a .194 mark at Daikin Park specifically. He struck out ten Orioles over six innings on July 17. The two clubs have met seven times this season and averaged exactly 7.0 total runs, a full run below tonight's number, and Tuesday's meeting landed on 8 exactly.
Two inputs push the projection back upward and the model applies both. Houston has issued 451 walks, more than any staff in baseball, has allowed 142 home runs, and carries a 4.74 team ERA, which means the innings after Lambert leaves are genuinely volatile. Alcantara's own road split is the one flagged above at 4.48 with ten of his fourteen home runs allowed away from Miami. Josh Hader also pitched on both Monday and Tuesday, so Houston's highest-leverage reliever may be unavailable. The projection survives all three, mostly because Miami has lost eight of its last ten and scores 4.46 per game while going 21-30 on the road.
Sizing And The Ledger
Four positions, four separate games, six units of win target, and no correlation anywhere on the card. Each ticket resolves independently of the other three.
Stakes track edge magnitude adjusted for the width of the confidence interval around each projection. New York takes 2.0 despite a modest 3.8-point edge because the underlying inputs, a walk rate over 94 innings and a team ERA over 101 games, are the most stable on the board. Cleveland and the Houston total take 1.5 each. Tampa Bay carries the largest raw edge and the smallest stake, because a bullpen game projection has a standard error roughly double that of a normal starter projection, and the Rays road split is a real and persistent drag.
Every figure above was pulled from the official league data feed on the morning of July 22 and reconciled against the day's box scores before the model ran. Records, probable starters, transaction status and venue splits matched across sources. The Fried activation and the Game 1 result were confirmed directly rather than assumed from the schedule.