MLB Picks, July 21, 2026 | Dodgers moneyline
Command Model: Free Bases Decide Eight MLB Prices On The July 21 Board
Published July 21, 2026 | Daily Model Breakdown | MLB Prediction Data Lab
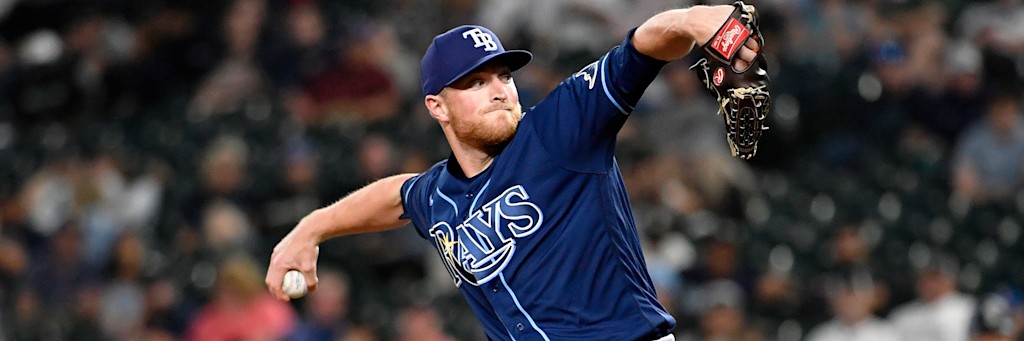
Fifteen starting pitchers take the ball tonight, and the distance between the best and worst of them on a single measurement is almost absurd. Drew Rasmussen has walked 17 hitters in 99.1 innings. Kendry Rojas has walked 16 in 19.1. One of those men gives away 1.54 free baserunners per nine innings; the other gives away 7.45. That five-run gap in donated offense is the axis this entire board turns on, and it is the reason a model that leads with walk rate rather than ERA arrives at eight positions the market has priced differently.
The Framework: Why Command Predicts Better Than Run Prevention
ERA is an outcome. It absorbs defense, sequencing, bullpen inheritance and park, and it takes most of a season to stabilize. Walk rate is a decision. A pitcher who cannot locate produces free baserunners at a rate that holds from start to start, and free baserunners are the rawest input to run scoring there is, because they arrive without requiring the opposing hitters to do anything well.
So the model builds its projection in that order. Command first, contact quality second, then offense rates, then park and bullpen state. When a starter's walk rate and his ERA disagree, the model trusts the walk rate and marks the ERA as unstable in either direction. Tonight there are four starters whose command grades sit two full standard deviations below the pack, and in every case the market has priced their teams as if the ERA were the truth.
| Starter | Walks | Innings | BB / 9 | Season ERA |
|---|---|---|---|---|
| Drew Rasmussen (TB) | 17 | 99.1 | 1.54 | 3.26 |
| Justin Wrobleski (LAD) | 20 | 100.1 | 1.79 | 2.69 |
| Zack Wheeler (PHI) | 22 | 93.0 | 2.13 | 2.13 |
| Ranger Suarez (BOS) | 26 | 91.1 | 2.56 | 3.15 |
| Kevin Gausman (TOR) | 32 | 112.1 | 2.56 | 4.33 |
| Luis Castillo (SEA) | 28 | 87.2 | 2.87 | 4.93 |
| Parker Messick (CLE) | 36 | 112.0 | 2.89 | 2.73 |
| Will Warren (NYY) | 33 | 98.1 | 3.02 | 4.03 |
| Chase Burns (CIN) | 37 | 102.2 | 3.24 | 2.54 |
| Kyle Bradish (BAL) | 50 | 107.1 | 4.19 | 3.61 |
| Brandon Sproat (MIL) | 39 | 82.0 | 4.28 | 5.16 |
| Bubba Chandler (PIT) | 55 | 94.1 | 5.25 | 4.77 |
| Kendry Rojas (MIN) | 16 | 19.1 | 7.45 | 2.79 |
Cluster One: The Two Games Where Both Starters Have Command
When neither side gives anything away, the model's run distribution compresses hard, and totals become the efficient instrument.
Dodgers at Phillies is the cleanest example on any board this month. Wheeler and Wrobleski rank third and second in walk rate among tonight's fifteen, and they arrive with matching contact suppression: Wheeler holds hitters to .185 with a 0.89 WHIP, Wrobleski to .219 with a 1.02. Wheeler's mix is what keeps that number stable, six pitches with no single offering above 36 percent usage, a 95 mph four-seamer at 35.9 percent working against an 81 mph sweeper at 14.4. Philadelphia's own offense is the second half of the case, 442 runs across 101 games, 4.38 per night on a .237 average. The under 9 requires 54.5 percent at -120. The model projects well past it and stakes 3 units.
The variance term is the Philadelphia bullpen, which has been worked without a break: five relievers Sunday, four Saturday including a 42-pitch appearance, five again Monday. A short Wheeler start hands a tired group the middle innings, and that pathway is where the over lives.
Rogers Centre is the second compression game and a smaller stake. Rasmussen's 1.54 walk rate is the lowest figure in the sample, and Gausman's 2.56 is better than his 4.33 ERA implies, a split the framework treats as evidence the ERA will drift down rather than the command drift up. Gausman's arsenal is the extreme case of commitment: a 94 mph four-seamer 51.3 percent of the time and an 84 mph splitter 38.6 percent, a two-pitch pattern that produces 116 strikeouts and also 15 home runs. Toronto's offense has scored 398 runs in 100 games, 3.98 per night, the lowest rate in the major leagues. The under 7.5 at -110 needs 52.4 percent. The model clears it and stops at 1.5 units, because Rasmussen's most recent start was a 2.1-inning, six-run collapse against the Yankees on July 9 and because Gausman's home run rate is a live path to a crooked inning.
Cluster Two: The Four Games Where One Side Cannot Throw Strikes
These are the positions the framework exists to find, and there are four of them.
Cleveland at -141 is the largest command gap of the night. Parker Messick walks 2.89 per nine across 112 innings with a 2.73 ERA and a 1.07 WHIP, working a 94 mph four-seamer at 34.3 percent usage against an 86 mph changeup at 23.7. Kendry Rojas has walked 16 men in 19.1 innings. His 2.79 ERA is the least stable number in the entire sample, propped up by a tiny workload, and his 1.60 WHIP is the honest tell. Minnesota has lost three straight behind a 4.75 staff ERA. The break-even at -141 is 58.5 percent, a demanding threshold, and the reason the stake stops at 1.5 units is Cleveland's own bat: 405 runs in 101 games, 4.01 per game, the second-lowest offensive rate in the league.
The Yankees at -131 sit on the same logic. Bubba Chandler has issued 55 walks in 94.1 innings, 5.25 per nine, the worst rate among tonight's starters with a full workload behind it. He has not reached six innings since June 30 and has averaged under five per start across his last four. Will Warren's 3.02 walk rate is unremarkable and sufficient, and behind him stands a 3.42 team ERA, the best in baseball. The counterweight is genuine and the model prices it: Pittsburgh has scored 538 runs, 5.33 per game, second most in the majors. A patient, productive lineup facing a wild pitcher is not the matchup, but a wild pitcher facing the Yankees is. The break-even is 56.7 percent and the position takes 2.5 units.
Boston at -136 is the third. Ranger Suarez walks 2.56 per nine and has allowed five home runs in 91.1 innings, the lowest home run total of any starter here. Kyle Bradish walks 4.19. The distribution of Bradish outcomes this season is exactly what a poor command grade predicts: eight shutout innings with nine strikeouts against the Angels on June 22, then four innings with five walks against Washington six days later. The model does not project the good version or the bad version, it projects the spread, and the spread favors the team with a 3.55 staff ERA. Two units at a 57.6 percent break-even. Two adjustments hold it there: Suarez is making his first start since the All-Star break, following a 2.2-inning outing on July 5, and Boston has played .449 baseball at Fenway Park this season against .580 on the road.
Milwaukee at -132 inverts the pattern and still clears. Brandon Sproat is the walk problem here, 4.28 per nine with 15 home runs allowed in 82 innings, and he is the reason the best team in baseball by winning percentage is available at that price. The offsetting inputs are large: Milwaukee is 63-37 and 33-18 at home, the Mets score 4.08 runs per game on a .233 average, and New York counters with a starter carrying 17.1 major league innings this season. The model treats Sproat as a genuine drag on the projection and stakes 1.5 units rather than the number the record alone would justify.
| Offense | Runs | Games | Runs / Game | Team AVG |
|---|---|---|---|---|
| Pittsburgh Pirates | 538 | 101 | 5.33 | .263 |
| Los Angeles Dodgers | 524 | 101 | 5.19 | .260 |
| Milwaukee Brewers | 510 | 100 | 5.10 | .253 |
| Minnesota Twins | 483 | 101 | 4.78 | .248 |
| New York Yankees | 475 | 100 | 4.75 | .237 |
| Baltimore Orioles | 464 | 101 | 4.59 | .238 |
| Philadelphia Phillies | 442 | 101 | 4.38 | .237 |
| Arizona Diamondbacks | 435 | 100 | 4.35 | .237 |
| Boston Red Sox | 419 | 99 | 4.23 | .245 |
| Cincinnati Reds | 414 | 99 | 4.18 | .230 |
| New York Mets | 412 | 101 | 4.08 | .233 |
| Seattle Mariners | 410 | 101 | 4.06 | .230 |
| Cleveland Guardians | 405 | 101 | 4.01 | .233 |
| Toronto Blue Jays | 398 | 100 | 3.98 | .242 |
Cluster Three: Where The Framework Runs Out Of Data
Two positions on this card cannot be solved by command grades, and the model handles them by different means.
Arizona at -133 involves a starter with no major league record of any kind. Kohl Drake has thrown no innings, and both the league feed and the national scoreboard return an empty statistical line for him. There is no walk rate to grade. The model treats an undefined starter as a wide-error league-average prior and then asks whether the rest of the inputs clear the 57.1 percent threshold without him. They do. The Athletics carry a 5.29 staff ERA and have surrendered 157 home runs, the highest total in baseball, and Jack Perkins brings a 6.87 ERA with outings of 3.2 and 3.0 innings in his last two turns. When one side of a matchup is undefined and the other side is decisively weak, the position is still playable, and this one takes 3 units on the strength of the visitors' measured deficiencies.
Seattle at -115 is the case where command grading gives the wrong answer, and the honest thing to do is say so. Chase Burns walks 3.24 per nine, a middling grade, and he is nonetheless 11-1 with a 2.54 ERA and 118 strikeouts in 102.2 innings, holding hitters to .206. He achieves it with two pitches, a 97.8 mph four-seamer at 57.1 percent usage and a 90.5 mph slider at 37.2, and no framework built on free bases will ever rate him correctly. The model still takes Seattle, and for reasons that live outside the pitching comparison entirely: Cincinnati bats .230 and scores 4.18 per game, Seattle plays in the most run-suppressing environment either club will see this week, and the Mariners are 30-21 at home on a three-game winning streak. The break-even at -115 is 53.5 percent. The projection clears it narrowly, and the stake is the minimum on the card at 1.5 units.
Sizing And The Ledger
Eight positions across eight games, 16.5 units of win target, and no correlation anywhere. Each ticket resolves independently, which means the variance of the card as a whole is close to the sum of its parts rather than compounded by shared outcomes.
Stakes follow the size of the command gap adjusted for how much of the projection rests on a stable sample. The Dodgers-Phillies under and the Arizona moneyline carry 3 units apiece, the first because both starters grade elite on the model's primary variable across roughly 100 innings each, the second because the opponent's weaknesses are measured across a full season even though the home starter is a blank. The Yankees take 2.5, Boston 2, and the last four take 1.5 each, each held there by a specific counterweight: Cleveland's own weak offense, Sproat's walk rate, Rasmussen's last outing, and the fact that the better pitcher in Seattle is wearing the visiting uniform.
Every figure above was pulled from the official league data feed on the morning of July 21 and reconciled against an independent scoreboard before the model ran. Records, probable starters and season rates matched on both sources. The one number that could not be confirmed anywhere, a walk rate for Arizona's starter, was left undefined rather than estimated, and the position was sized as though it were.