MLB Picks, July 20, 2026
Streak Noise Model: Brewers Win Probability, Rays-Blue Jays Under 7.5 And Two Team Total Unders Lead The July 20 Board
Published July 20, 2026 | Daily Model Breakdown | MLB Prediction Data Lab
Tonight's slate is a stress test for anyone who claims to price true talent. The Red Sox have won 13 in a row. The Athletics have lost nine of ten. The Rays have dropped five straight. Recency is screaming from every direction, and the model's core discipline is to treat a streak as an outcome, never an input. What goes into the projection is rate data across meaningful samples: a 0.76 WHIP over 111 innings, a 3.92 runs-per-game offense across 100 games, a 6.08 ERA that has held for 19 starts. On July 20 that discipline produces six positions, and two of them run directly against the loudest streaks in baseball.
The Framework: A Streak Is An Outcome, Not An Input
Ten games of results carry almost no predictive weight next to 100 games of rates. A team that wins 13 straight has usually gotten three things at once: good pitching, sequencing luck, and a soft patch of schedule, and only the first of those persists. So the model strips streaks out entirely and rebuilds each game from conditional rate inputs, starter splits for tonight's venue, offense runs per game, team ERA, walk and strikeout rates. Where the market has moved a price because of the streak itself, the difference between that price and the rate-based number is the edge, in either direction.
The clearest illustration on this board is Boston. Thirteen consecutive wins, and yet across all 98 games the Red Sox score 4.21 runs a game on a .244 average with a .708 OPS, mid-tier offensive rates that a fortnight cannot rewrite. The streak was built on run prevention, a 3.53 staff ERA and 368 runs allowed, the fewest of any club playing in tonight's featured games. The market prices the whole team hot. The rates say only half of it is.
| Starter | Season ERA | WHIP | K/9 | Tonight's Split ERA |
|---|---|---|---|---|
| Jacob Misiorowski (MIL, home) | 1.62 | 0.76 | 13.54 | 1.59 home |
| Dylan Cease (TOR, home) | 2.56 | 1.13 | 13.55 | 2.82 home |
| Nick Martinez (TB, road) | 2.65 | 1.12 | 5.30 | 2.12 road |
| Joe Ryan (MIN, road) | 2.85 | 1.05 | 10.44 | 2.47 road |
| Freddy Peralta (NYM, road) | 4.66 | 1.44 | 8.97 | 5.58 road |
| Jeffrey Springs (ATH, road) | 6.08 | 1.42 | 7.74 | 5.19 road |
Brewers -190: When The Chalk Is Still Underpriced
Milwaukee at -190 over the Mets needs to win 65.5 percent of the time to break even, a demanding threshold the model rarely endorses. The input gap here is the widest of the week. Jacob Misiorowski has faced 111 innings' worth of hitters and held them to a .148 average and a .450 OPS, with 167 strikeouts against 27 walks. His WHIP is 0.76. At American Family Field the numbers compress further, 1.59 ERA and 0.74 WHIP over 62.1 innings. Every one of those figures sits at the extreme of its distribution, and the sample is large enough that regression barely dents them.
Now the other side of the equation. Freddy Peralta arrives with a 4.66 ERA and a 1.44 WHIP, a road split of 5.58 with an .844 OPS allowed, and three consecutive starts of fewer than five innings. The Mets score 4.09 runs a game on a .234 team average, and tonight they must do it against a starter holding the entire league to a .450 OPS. Milwaukee's own offense at 5.07 runs a game against Peralta's road profile gives the home side both halves of the win-probability ledger. The model clears 65.5 percent with margin, and the position takes 3 units. The general rule against heavy chalk is a rule about unmeasured gaps; this one is measured.
Rays-Blue Jays Under 7.5: Two Arms, One Cold Lineup, One Honest Naive Baseline
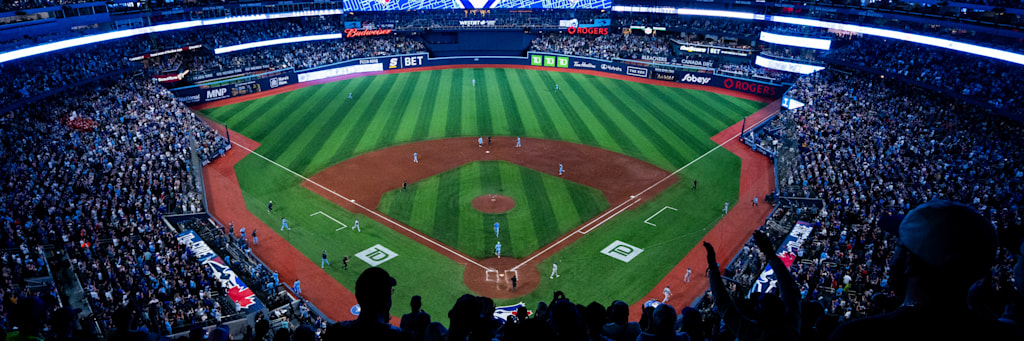
Begin with the naive arithmetic, because it argues against the bet. Tampa Bay scores 4.44 runs a game and Toronto 4.01, and 4.44 plus 4.01 is 8.45, a full run above the 7.5 number. A season-average model passes. The conditional model does not, because neither season rate survives tonight's starters. Dylan Cease brings a 2.56 ERA, a .190 average against, and 15 consecutive scoreless innings, seven against Seattle on July 3 and eight one-hit frames against San Francisco on July 8, with 20 strikeouts across the two. Nick Martinez counters with a 2.65 ERA and a 2.12 road split, walking 1.62 per nine so that his contact-heavy profile, 5.30 strikeouts per nine, rarely compounds into big innings.
Layer the offensive conditionals on top. Toronto hits .242 with a .687 OPS. Tampa Bay's five-game losing streak is itself just noise, but the underlying rates were never elite, and a lineup at .731 OPS facing a pitcher with 13.55 strikeouts per nine projects well below its season rate. The under at -115 requires 53.5 percent. The model clears it and stakes 2 units, with a supplementary position on the first inning: the NRFI at -134 needs 57.3 percent, and Martinez's first-inning line, a 1.00 ERA with a 0.89 WHIP and .562 OPS allowed over 18 first frames, carries it. The variance term is Cease's own first inning, a 3.18 ERA with seven first-inning runs allowed in 17 starts, which is exactly why the price is -134 and the stake is 1.5 units rather than heavier.
Two Team Totals Where The Market Priced The Wrong Half
Boston's team total sits at 4.5 with the under at -130, a 56.5 percent requirement. The rate case: a 4.21 runs-per-game offense faces Shane Baz, whose road profile, 1.30 WHIP and .705 OPS allowed over 61.1 road innings, runs meaningfully cleaner than his 4.19 season ERA suggests, and whose last start produced nine strikeouts without a walk. The model's read is that the streak inflated the offensive number by more than the underlying rates justify. Baz's 3.39 walks per nine is the honest variance term, and it holds the stake at 1.5 units.
Texas gets the same treatment from the other direction. The Rangers score 4.16 runs a game on a .245 average, 412 runs across 99 games, and face Erick Fedde, who has allowed five earned runs over his last 14.1 innings behind a White Sox staff with a 4.04 ERA. The under 4.5 at -140 needs 58.3 percent. Fedde's road split, a 5.48 ERA away from home, is the largest single risk factor anywhere on this card, and the model only clears the threshold because the offensive rate is so low and the recent form so specific: four shutout innings against the Athletics on July 11, two earned or fewer in each of his last two. 1.5 units, no more.
| Offense | Runs / Game | Team AVG | OPS | Last 10 |
|---|---|---|---|---|
| Milwaukee Brewers | 5.07 | .253 | .733 | 6-4 |
| Colorado Rockies | 4.79 | .255 | .747 | 3-7 |
| Boston Red Sox | 4.21 | .244 | .708 | 10-0 |
| Texas Rangers | 4.16 | .245 | .719 | 5-5 |
| New York Mets | 4.09 | .234 | .686 | 5-5 |
| Toronto Blue Jays | 4.01 | .242 | .687 | 4-6 |
| Cleveland Guardians | 3.92 | .230 | .678 | 5-5 |
The Rest Of The Board: Arizona, Cleveland And A Coors Variance Play
Arizona -154 against the Athletics is the model's cleanest talent-gap play after Milwaukee. Jeffrey Springs carries a 6.08 ERA, a 1.42 WHIP, and 26 home runs allowed in 97.2 innings, with six earned runs in each of his last two starts, against a Diamondbacks club that has won seven of ten and plays .580 baseball at home, 29-21. The uncertainty lives on Arizona's own mound: Mitch Bratt owns exactly six major league innings with five walks, a sample the model treats as near-zero information and prices at league-average with enormous error bars. The 60.6 percent requirement at -154 still clears on the strength of the opponent inputs alone, at 2.5 units.
Cleveland hosts Minnesota with the quietest offense in tonight's fourteen-team sample, 3.92 runs a game on a .230 average, behind a 3.76 staff ERA. Joe Ryan's road conditionals, 2.47 ERA and 1.00 WHIP over 51 innings, plus Tanner Bibee's 1.15 WHIP put the under 7.5 at -110 in range, though Minnesota's 4.79 runs a game and Bibee's 20 home runs allowed keep this at 1 unit, the smallest conviction on the card. And in Denver, the model takes Colorado at +107, a pure variance position: Washington starts Andrew Alvarez, a rookie walking 4.04 per nine with 22 walks in 49 innings, in the park where free baserunners are most expensive, while Kyle Freeland's 1.84 walks per nine limits the same failure mode despite his 7.36 ERA. Plus money means the bet needs just 48.3 percent, and Washington's excellent 30-19 road record is the reason the stake stays at 1.5 units.
Sizing And The Honest Ledger
Eight positions, six games, 14.5 units of win target. The Toronto under and the Toronto NRFI are correlated by construction, one bad first inning damages both, so they function as a single 3.5-unit opinion about Cease and Martinez. Everything else is mechanically independent. Stakes are ordered by the gap between the rate-based projection and each price's break-even: widest at Milwaukee, narrowest at Cleveland and Coors.
Every figure in this breakdown was pulled from the official league data feed on the morning of July 20 and reconciled against a second source before the model ran. Anything that failed the double-check was cut. The through-line is the streak discount: 13 straight wins, nine losses in ten, five defeats in a row, all of it is outcome data the model has already digested as rates. Tonight the market is still paying for the stories. The card is the difference.