MLB Picks, July 19, 2026 | Team total under
Split-Adjusted Run Model: Cardinals Team Total Under, Nationals Moneyline And A Seattle Under Lead The July 19 Board
Published July 19, 2026 | Daily Model Breakdown | MLB Prediction Data Lab
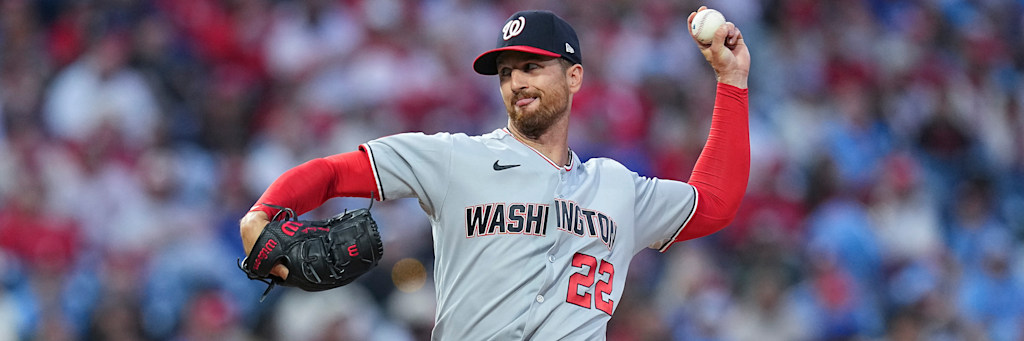
A season-long ERA is an average of two different pitchers. Eduardo Rodriguez's 2.29 blends a 1.89 at Chase Field with a 2.85 everywhere else. Foster Griffin's 2.77 blends a road version who allows a .574 OPS with a home version a full tier below that. Marginal value in totals and moneyline markets comes from weighting the split that applies tonight rather than the average that applies to no game in particular. On July 19 the model finds three spots where the split-adjusted number diverges from the market price: the Cardinals team total under 4.5 at -138, the Nationals moneyline at -143, and the Giants-Mariners under 7.5 at -120.
The Framework: Season Averages Are Biased Estimators Of Tonight's Run Environment
The model's core adjustment this week is simple to state. For any single game, the relevant pitching inputs are conditional: the home split for the home starter, the road split for the visitor, both regressed toward the season mean in proportion to sample size. A 66.2-inning home sample, like Rodriguez's, retains most of its signal after regression. A 20-inning split would not. All three of today's positions survive that discount, because the splits driving them are built on 47 to 66 innings of 2026 data, pulled and reconciled against the official league feed this morning.
The same logic applies to offense. St. Louis scores 4.51 runs a game on the season, but the venue-conditional numbers are 3.67 at Busch Stadium and 5.47 on the road, an unusually wide venue gap for a single offense. That road figure is the single biggest threat to the model's top play, and it is priced into the sizing below rather than ignored.
| Starter | Season ERA | Tonight's Split ERA | Split WHIP | Split OPS Allowed |
|---|---|---|---|---|
| Eduardo Rodriguez (ARI, home) | 2.29 | 1.89 | 0.95 | .576 |
| Foster Griffin (WSH, road) | 2.77 | 2.79 | 0.93 | .574 |
| Logan Gilbert (SEA, home) | 3.32 | 4.11 | 0.99 | .698 |
| Robbie Ray (SF, road) | 3.38 | 4.53 | 1.38 | .807 |
| Andre Pallante (STL, road) | 3.96 | Not an input to the STL team total | ||
| Jacob Lopez (ATH, home) | 6.83 | 1.79 season WHIP, 5.53 BB/9 | ||
Cardinals Team Total Under 4.5: A 66-Inning Home Sample Against A .707 OPS Offense
Market makers hang a 4.5 team total on a St. Louis club that averages 4.51 runs a game, which is what a naive season-average model would call a coin flip. The conditional read is very different. Rodriguez at Chase Field has thrown 66.2 innings with a 1.89 ERA, a 0.95 WHIP, and a .576 OPS allowed. An offense hitting .242 with a .707 OPS, below the league midpoint in most of the model's offensive components, now has to clear four and a half runs against a starter who has allowed opponents to perform like a pitcher at the plate in his own park all season.
Split-adjusted, the model's projection for Cardinals runs tonight lands near 3.6 expected runs, against a break-even requirement of 58.0 percent at -138. The distribution matters as much as the mean: with Rodriguez completing six or more innings in each of his last three starts, five earned runs combined across that stretch, the bullpen innings exposed to St. Louis shrink, and short exposure to middle relief is the main channel through which team totals blow past their number.
Every projection needs a variance term, and here it is the Cardinals' own split. A road offense scoring 5.47 runs a game in a hitter-friendly building is exactly the profile that produces the right tail, and the model widens its error bars accordingly. That is why this position carries 1.5 units rather than headline sizing. The mean projection clears the price comfortably; the variance keeps the stake honest. Note also what is not in this bet: Andre Pallante's 3.96 ERA affects the game total, not the St. Louis team total, so his recent inconsistency is irrelevant here.
Nationals Moneyline -143: The Largest Input Gap On The Board
Strip the uniforms away and price the inputs. One starter is 10-2 with a 2.77 ERA over 110.1 innings, a 1.02 WHIP, and a road split of 0.93 baserunners per inning with a .574 OPS allowed. The other carries a 6.83 ERA, a 1.79 WHIP, a .293 average against, and 34 walks in 55.1 innings, a 5.53 BB/9 that hands out free baserunners faster than any defense can erase them. Foster Griffin against Jacob Lopez is the widest single-game starter gap the model has measured this week, and the market is charging only -143 for the right side of it, a 58.8 percent break-even.
Surrounding inputs push the same direction. Washington's offense produces 5.45 runs a game with a .764 OPS and 142 home runs, the best offensive dataset in today's six-team sample, and it travels: the Nationals are 29-19 on the road against 20-31 at home, a genuine road-performance signature rather than noise. Sacramento's Athletics have lost nine of ten, their staff ERA of 5.33 and 552 runs allowed are the worst marks in the sample, and Lopez's walk rate feeds the exact plate-discipline profile Washington's lineup punishes. Griffin's form term is also positive: 19 innings, two earned runs, and twenty strikeouts against three walks over his last three starts.
Counterweights exist, and they are quantifiable. Washington is 3-7 in its last ten, the bullpen's 4.85 ERA erodes late-game win probability in any close simulation, and Sutter Health Park has played generously to hitters, which raises variance for a moneyline favorite. The model's simulated win probability for Washington still clears the 58.8 percent requirement with room to spare, and the position takes 2 units.
Giants-Mariners Under 7.5: A Run Environment Two Standard Deviations Quiet
Position three is an environment play. Seattle's offense scores 4.00 runs a game on a .227 average, and at T-Mobile Park those numbers compress further to 3.94 runs a game with a .683 OPS. San Francisco's season rate is 4.13. The Mariners' pitching staff owns a 3.62 ERA, the best team mark on today's board, and the two starters, Robbie Ray at 3.38 and Logan Gilbert at 3.32 with a 0.99 WHIP and 119 strikeouts against 24 walks in 114 innings, are both above-average run preventers in the model's blend. Layer one of the American League's strongest run-suppressing venues over all of it and the split-adjusted total lands near 6.8 expected runs against a market number of 7.5.
At -120 the bet needs only 54.5 percent, the friendliest break-even on the card, and it takes the largest stake at 2.5 units. But the model flags two inputs pushing the other way, and honesty about them is part of the read. Gilbert's home-road ERA split is inverted this year, 4.11 at home against 2.23 on the road, even though his WHIP is 0.99 in both halves, which suggests sequencing noise rather than a true talent difference but still widens the distribution. And San Francisco's road offense, 4.41 runs a game with a .750 OPS, is meaningfully livelier than its season average. The projection clears the number on the strength of the venue and the Seattle offense's floor; it does not clear it by multiple runs.
| Offense | Runs / Game | Tonight's Venue Split | Team AVG | OPS |
|---|---|---|---|---|
| Washington Nationals | 5.45 | 5.58 road | .251 | .764 |
| St. Louis Cardinals | 4.51 | 5.47 road | .242 | .707 |
| Athletics | 4.50 | 4.50 season | .245 | .728 |
| Arizona Diamondbacks | 4.34 | 4.34 season | .237 | .693 |
| San Francisco Giants | 4.13 | 4.41 road | .256 | .729 |
| Seattle Mariners | 4.00 | 3.94 home | .227 | .684 |
Sizing, Correlation And The Honest Ledger
All three positions are mechanically independent, three different games and three different bet types, which keeps portfolio correlation near zero. Within each bet, the dominant risk is concentrated in a single input: Rodriguez's home form, Griffin holding a lead in front of a 4.85 ERA bullpen, and the T-Mobile Park run environment behaving like its season-long self. The stake ladder runs 1.5 units on the Cardinals under at -138, 2 units on the Nationals moneyline at -143, and 2.5 units on the Giants-Mariners under 7.5 at -120, ordered by the gap between the model's projection and each price's break-even, not by raw confidence in any single outcome.
Every figure in this breakdown was pulled from the official league data feed on the morning of July 19 and cross-checked against a second independent source before the model ran. Anything that could not be verified twice was excluded. The through-line is conditional data: season averages describe a schedule that already happened, and splits describe the game in front of you. Tonight, all three prices were set closer to the averages than to the splits. That gap is the card.