Brewers vs Angels Prediction, July 18, 2026 | Team total under
Run Suppression Model: Brewers And Angels Team Total Unders Lead The July 18 Board
Published July 18, 2026 | Daily Model Breakdown | MLB Prediction Data Lab
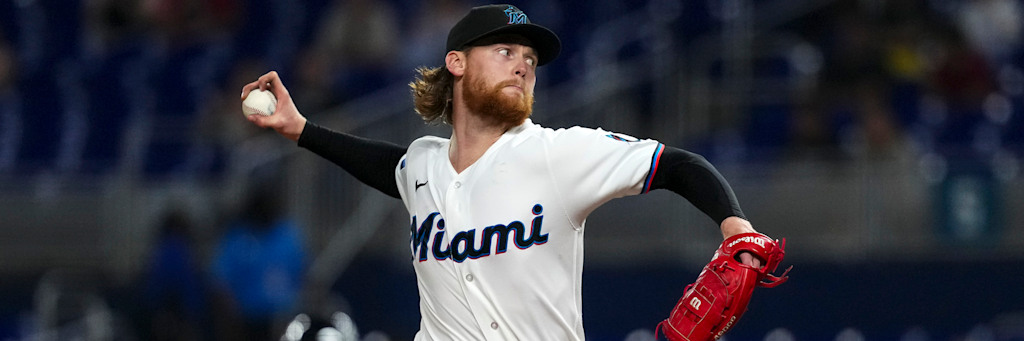
The model does not care that the Milwaukee Brewers are the best offense on tonight's slate. It cares that the arm standing between them and the scoreboard is running a 2.58 ERA with a 1.11 WHIP, and that single input reshapes the entire team-total distribution. Run suppression is a pitcher-first calculation, and on July 18 the two lowest projected offensive outputs on the board both belong to lineups facing the two best strikeout arms available. Here is the data behind four plays.
The Framework: Why WHIP Drives Team Totals More Than Runs Per Game
Team totals get mispriced because casual money reads the standings and the runs-per-game column, then sets an expectation off the offense in a vacuum. The model inverts that. For a team total, the single most predictive variable is the opposing starter's ability to keep the bases empty, because a lineup cannot score the runs it never puts on base. WHIP captures that directly, and the two arms anchoring this card sit at the extreme low end of the distribution.
Tarik Skubal carries a 0.95 WHIP across 75.2 innings with 89 strikeouts and a 3.09 ERA. Max Meyer sits at a 1.11 WHIP over 108 innings with 116 strikeouts and a 2.58 ERA. Those are the two cleanest baserunner-suppression profiles on the slate, and both draw offenses that lean on power rather than on-base volume, the exact hitter type most vulnerable to a strikeout arm who lives in the zone. That combination is what pushes the model onto both team-total unders.
| Starter | ERA | WHIP | K / IP |
|---|---|---|---|
| Tarik Skubal (DET) | 3.09 | 0.95 | 89 / 75.2 |
| Max Meyer (MIA) | 2.58 | 1.11 | 116 / 108.0 |
| Logan Webb (SF) | 3.86 | 1.16 | 80 / 100.1 |
| Bryan Woo (SEA) | 4.23 | 1.07 | 102 / 104.1 |
Angels Team Total Under 3.5: The Model's Highest-Confidence Suppression Spot
Skubal versus the Los Angeles Angels is the widest talent gap on the card. The Angels are scoring 4.40 runs a game, but that number is built on a .239 team average and a .705 OPS, a profile that gets to its run total through the home run rather than through sustained traffic. Against a starter with a 0.95 WHIP, the rally paths dry up, and a power-dependent lineup is left needing one swing to clear a low bar.
The number sits at 3.5 with the under priced at -145. The model's projected Angels output against Skubal and the Detroit bullpen lands near 2.7 expected runs, which puts the under probability meaningfully above the -145 break-even of 59.2 percent. Grayson Rodriguez opposing on the Angels' side is a non-factor for this specific bet, since the Angels' scoring projection depends only on Skubal and the relief arms behind him, not on what happens when Los Angeles takes the mound.
Honesty demands the variance note. A 3.5 line is low enough that a single three-run inning ends the bet, and the Angels have the raw power to produce that from one at-bat. The model prices that risk in and still lands on the under, but it is the reason this is a measured play rather than a blind hammer. The distribution is favorable, not deterministic.
Brewers Team Total Under 4.5: Betting The Arm Over The Best Bats On The Board
Milwaukee presents the model's most interesting tension. The Brewers score 5.06 runs a game, the highest mark in this group, with a .254 average and a .734 OPS. Projecting them under 4.5 is a direct statement that the pitcher outweighs the offense, and the pitcher is Max Meyer at a 2.58 ERA and a 1.11 WHIP across a substantial 108-inning sample.
Meyer's season is not a fluke of a few starts. Nineteen starts, 116 strikeouts, and a sub-2.60 ERA describe a genuine front-of-rotation arm, and his ability to miss bats keeps even a productive lineup from stringing together the multi-hit innings that push a team total over 4.5. The line sits at -140, an implied 58.3 percent, and the model's projected Brewers output lands a hair above four runs, clearing the price with a modest edge rather than a wide one.
This is the lighter-conviction of the two team-total unders precisely because Milwaukee's offense is legitimate and deep. If Meyer exits early, the Brewers lineup will punish the middle relief, and the under is in immediate trouble. The play is a bet on Meyer's form holding for one more start, which the 108-inning body of work supports without guaranteeing.
Cardinals At Diamondbacks Under 9: A Two-Sided Offensive Regression Read
The Cardinals-Diamondbacks game total is a different mechanism from the two team-total unders. Here the edge is not a dominant arm but two below-average offenses meeting two mid-rotation starters. Dustin May carries a 4.55 ERA with a 1.26 WHIP for St. Louis, and Brandon Pfaadt counters at a 4.70 ERA and a 1.32 WHIP for Arizona. Neither profile suppresses runs on its own.
The lean comes from the bats. St. Louis is at 4.52 runs a game on a .242 average, and Arizona sits at 4.33 with a .237 average and a .693 OPS, one of the quieter lines in the National League. Two offenses running below league pace, even against ordinary pitching, project to a game that settles in the low-to-mid single digits more often than the market's total of 9 implies. The under is priced at -120.
| Offense | Runs / Game | Team AVG | OPS |
|---|---|---|---|
| Milwaukee Brewers | 5.06 | .254 | .734 |
| Los Angeles Angels | 4.40 | .239 | .705 |
| St. Louis Cardinals | 4.52 | .242 | .708 |
| Arizona Diamondbacks | 4.33 | .237 | .693 |
| Seattle Mariners | 4.00 | .228 | .686 |
The venue is the honest counterweight. Chase Field plays as a hitter-friendly environment, and neither May nor Pfaadt is the type to keep the ball in the yard against even a mediocre lineup. A total of 9 already accounts for the park, which is why the model treats this as its lightest position of the four, a one-unit lean rather than a core play.
Giants Run Line Plus 1.5: A Pitcher-Park Correlation Play
The lone side on the card lives in Seattle, and it follows the same run-environment logic. The model projects a low-scoring game, and in a low-scoring game the run line for the visiting underdog with the better starter carries value. San Francisco starts Logan Webb at a 3.86 ERA and a 1.16 WHIP, a half-run of ERA better than Seattle's Bryan Woo at 4.23, though Woo owns the cleaner 1.07 WHIP.
The suppressing variable is the Seattle offense. The Mariners score just 4.00 runs a game on a .228 average, the lowest output in this four-game group, and T-Mobile Park ranks among the most run-suppressing venues in the American League. A weak home lineup in a pitcher's park facing the better starter is the profile of a one-run game, and the Giants run line at +1.5, priced at -180, is the model's expression of that. The steep juice is the cost of a projection that keeps this game inside a single run more often than not.
The Verified Slate At A Glance
Every figure on this page was pulled and reconciled against the official league feed on the morning of July 18 before a single projection ran, and anything that could not be confirmed was left out. The through-line is run suppression: two team-total unders anchored by the best WHIP profiles on the board, a game total driven by two regressing offenses, and a run line built on a weak home lineup in a pitcher's park. The model sizes them from a one-unit lean on the Cardinals-Diamondbacks under up through the Angels under, the Brewers under, and the Giants run line as the anchor side. Read the distributions, respect the correlation between the two suppression unders, and let the pitching inputs do the work they are best at.