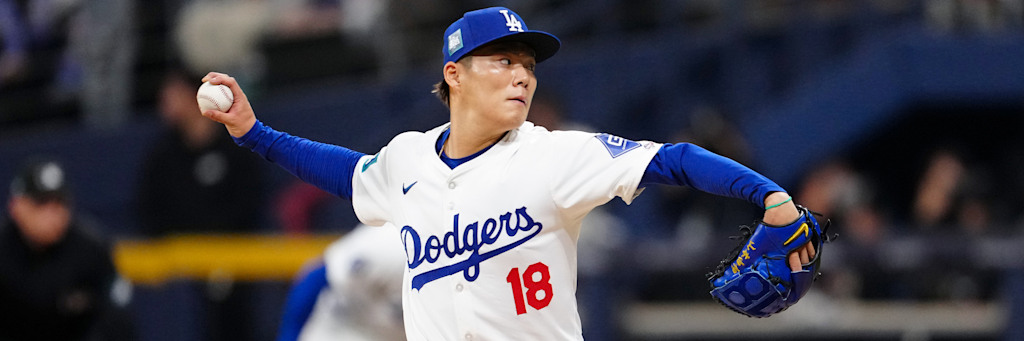
Opponents are hitting .190 against Yoshinobu Yamamoto this season. Sit with that number for a second, because the entire July 11 card grows out of it. A .190 opponent average with a 0.88 WHIP over 104.2 innings means Yamamoto faces roughly one baserunner per inning less than a league-average start produces, and when the team total engine ran the Arizona lineup against that profile, it returned the narrowest single-team run distribution of the day. The market posted Arizona's total at 3.5 and the model wanted it lower. That is the anchor. Around it, the engine found five more suppression edges and two win-probability gaps, and the interesting part of this card is not any single output but how consistently the same structural read, elite WHIP against a mid-tier run column, repeats across the board.
The Method: Why The Engine Prefers Team Totals To Game Totals
A game total is the sum of two random variables. A team total is one of them, isolated. That distinction sounds trivial and is anything but, because the variance of a sum is larger than the variance of either component, and betting edges live in variance. When the model projects a run column for one lineup against one starter and one bullpen, the output distribution is tight enough to compare honestly against a posted number. Ask the same model for a full-game projection and the band widens, because now two offenses, two bullpens, and two managers all contribute tails. That is why five of today's eight outputs isolate a single run column, three team totals, one first-inning derivative, and one moneyline that is functionally a bet on one pitching staff. The two full-game unders that made the card only qualified because both sides of each game independently project below their market share of the number.
Arizona Under 3.5: The Narrowest Band The Model Produced
| Input | Value |
|---|---|
| Yamamoto 2026 | 2.49 ERA, 0.88 WHIP, .190 opp AVG, 100 K / 21 BB in 104.2 IP |
| Arizona offense | 4.28 runs per game, .237 AVG, 20-27 on the road |
| Dodgers context | 61-34, 31-17 at home, 3.50 staff ERA |
| Output | D-backs team total under 3.5 (-140), 2 units |
The projection is straightforward multiplication. Arizona scores 4.28 runs per game against average pitching, and Yamamoto is not average pitching: his strikeout-to-walk ratio is nearly five to one, and the .190 opponent average removes the sequencing that multi-run innings require. Shift a 4.28 run column down for an ace of this quality and the median lands near three, with the mass of the distribution below the 3.5 line. The break-even at -140 is 58.3 percent, and the model's under probability cleared it with the widest margin of any output today, which is why this play would headline the card on edge alone even at 2 units.
The counterweight the model cannot ignore: Arizona has scored a first-inning run in 10 of its last 19 games. This lineup front-loads its offense, and a two-run first against anyone puts a 3.5 line on life support with eight innings of Los Angeles bullpen still to survive. The engine discounts recent first-inning frequency as noise around a season-long mean, but it is the one input pattern that argues against the play, so it is the one worth stating plainly.
The Detroit Regression Fade: A 9-1 Stretch Meets A 2.62 ERA
Detroit is 9-1 over its last ten, has won six straight, scored 45 runs in eight July games, and beat Philadelphia 10-2 last night. The model's response is the heaviest output on the card: Tigers team total under 3.5 at -140 for 3 units, paired with the Phillies moneyline at -134 for 1.5. This is what regression to the mean looks like when you operationalize it. Detroit's full-season scoring rate is 4.31 runs per game, its roster is 44-50, and the six-game surge is exactly the kind of streak that small-sample luck produces in a 94-game season. The starter it faces tonight, Cristopher Sanchez, has a 2.62 ERA and a 1.16 WHIP across 120.1 innings with 137 strikeouts against 24 walks. The model treats last night's ten runs as already spent information. The market, pricing Detroit's total at 3.5 with only -140 attached, is effectively offering the season-long Tigers rather than the July version, and the season-long Tigers against a top-tier left-hander project under three runs more often than not.
The moneyline companion is smaller for a defensible reason: Casey Mize is having a quietly excellent year at a 2.64 ERA and a 0.98 WHIP, so the pitching matchup itself is nearly even. The 1.5-unit Philadelphia lean rests on the roster gap, 52-43 against 44-50, not on the mound. If you only take one side of this game, the model says take the total, not the winner.
Opener Leverage: The Yankees At -191
| Item | Yankees | Nationals |
|---|---|---|
| Starter | Cam Schlittler: 2.01 ERA, 0.93 WHIP, 131 K in 112 IP | PJ Poulin: 2.83 ERA but 35 IP in 10 starts, 22 K / 20 BB |
| Staff ERA | 3.40 | 4.76 |
| Record | 52-42, 29-22 on the road | 48-47, 20-29 at home |
The Poulin row is the whole bet. A 2.83 ERA looks respectable until you divide innings by starts and get three and a half, at which point the label changes from starter to opener and the projection changes with it. Poulin walks nearly as many hitters as he strikes out, 20 against 22, and once he departs, the remainder of the game belongs to a Washington staff carrying a 4.76 ERA. Against that, Schlittler has been the best arm on this card all season: 2.01 ERA, 0.93 WHIP, 131 strikeouts, a .201 opponent average, and an average of nearly six innings across his 19 starts. The model projects roughly six innings of elite run suppression against five-plus innings of below-average bullpen, and that asymmetry is what justifies laying -191, a 65.6 percent break-even, for 3 units. The honest tail: Washington scores 5.38 runs per game, the highest rate of any team on this card, and New York is 4-6 over its last ten. High-variance offenses beat steep chalk occasionally. The model lays it anyway because the innings-quality gap is the largest it measured today.
Petco And The Trop: Two Game Totals That Qualified
Only two full-game unders survived the variance filter. At Petco Park, Toronto at 4.05 runs per game meets San Diego at 3.89, the two thinnest offenses on the card, with a .225 Padres team average that has produced 36 runs in ten July games. Trey Yesavage holds opponents to a .181 average, the lowest figure of any starter today, with a 1.08 WHIP. Both run columns independently project under their share of the 8, so the under at -115 earns 2 units. The derivative play is the NRFI at -125 for 1 unit: Toronto has scored in the first inning in 4 of its last 18 games, San Diego in 5 of its last 20, and the first inning is the only frame where you know exactly which arm faces which hitters. Walker Buehler's 5.07 ERA and 1.39 WHIP are the named risk in both positions, and the model sizes accordingly, 2 units and 1, rather than pretending the risk away.
At Tropicana Field, Logan Gilbert brings a 0.95 WHIP and 114 strikeouts in 107.1 innings into a dome where weather never inflates a total, against a Seattle lineup hitting .230 that has scored 27 runs in eight July games and lost four straight. Griffin Jax has a 3.60 ERA across 13 starts for a 55-37 Tampa Bay club that is 34-14 at home. The under 7 at -105 breaks even at 51.2 percent, the cheapest ticket on the card, and the model's projection cleared that bar comfortably even with the low posted number.
The Rangers Total And The Signals That Did Not Make The Card
The last output is the Rangers team total under 4.5 at -147 for 1.5 units. Peter Lambert is the least famous quality input of the day: a 3.26 ERA, a 1.15 WHIP, and a .205 opponent average across 80 innings, numbers that sit in the same neighborhood as far bigger names. Texas averages 4.15 runs per game on the season, and the steep -147, a 59.5 percent break-even, is the main thing holding the stake down, along with Texas scoring 40 runs in its last eight games including consecutive seven-run nights. Season-long signal against July noise, again, with the stake trimmed to match the price.
Transparency matters more than any single result, so here is what else the team total engine flagged today. The raw signal board also produced under edges on the White Sox team total at 4.5, the Giants team total at 4.5, and the Mets team total at 4.5, and its two strongest under reads outside the official card sat on the Blue Jays and Padres individual team totals, which the card expresses through the game under and the NRFI instead. Signals become official plays only when the price, the lineup information, and the projection margin all clear thresholds together. Today five unders cleared. Three did not. Publishing the misses alongside the makes is the only way a model earns trust.
The Full Card, Ranked By Distribution Width
| Rank | Output | Line | Stake | Why it ranks here |
|---|---|---|---|---|
| 1 | D-backs team total under | 3.5 (-140) | 2u | Narrowest band of the day: .190 opp AVG vs a 4.28 R/G column |
| 2 | Tigers team total under | 3.5 (-140) | 3u | Largest projection-vs-market gap, regression against a 9-1 run |
| 3 | Yankees moneyline | -191 | 3u | Opener leverage: 6 elite innings vs 5-plus bullpen innings |
| 4 | Jays/Padres under | 8 (-115) | 2u | Both run columns independently project under their share |
| 5 | Mariners/Rays under | 7 (-105) | 1.5u | Cheapest break-even on the card at 51.2 percent |
| 6 | Rangers team total under | 4.5 (-147) | 1.5u | Clean projection, steepest juice |
| 7 | Phillies moneyline | -134 | 1.5u | Roster gap only; the mound is a wash |
| 8 | Jays/Padres NRFI | -125 | 1u | Strong inputs, single-inning variance |
What Beats This Card
Regression is a tendency, not a schedule. Detroit can keep hitting for one more night, and if it does, the two heaviest correlated outputs on this card, the Tigers under and the Phillies moneyline, lose together. Arizona's first-inning pattern, ten early strikes in nineteen games, is the direct threat to the anchor play. The Yankees at -191 carry the fattest single-bet tail because Washington's 5.38 runs per game can beat any projection in one inning. Walker Buehler's 5.07 ERA is the weak link under both Petco positions, the Rangers total needs July Texas to cool, and the NRFI can die on one first-inning mistake from either side. Lineups were not final at publication, so every projection assumes listed probables. The model is favored on each output. Favored is a probability, not a promise.
Final Verdict
The July 11 model card is six suppression plays and two win-probability bets built on one repeating structure: elite WHIP against a mid-tier run column. The Diamondbacks team total under 3.5 at -140 is the cleanest signal, the Tigers team total under 3.5 at -140 for 3 units is the largest edge, a regression bet one night after Detroit scored ten, and the Yankees moneyline at -191 for 3 units monetizes an opener mismatch. The Blue Jays-Padres under 8, NRFI at -125, Mariners-Rays under 7, Rangers team total under 4.5, and Phillies moneyline at -134 complete the eight. For the methodology behind these projections, read how the MLB prediction model works, review the model's public graded results, browse the advanced stats hub, and compare yesterday's July 10 run-prevention model or the full model archive.
Related Model Breakdowns
More daily run-environment reads built on the same distribution framework:
- July 10 run-prevention model: Diamondbacks-Dodgers under and the Rays moneyline
- July 8 run-environment model: Giants-Blue Jays under and the Twins team total
For the inputs behind every projection, read how the MLB prediction model works, and review the model's public track record and graded results.