MLB Picks, July 27, 2026 | Team total under
The Talent Gap Model: Five Monday Plays Where Roster Depth Outweighs The Record
Published July 27, 2026 | Daily Model Breakdown | MLB Prediction Data Lab
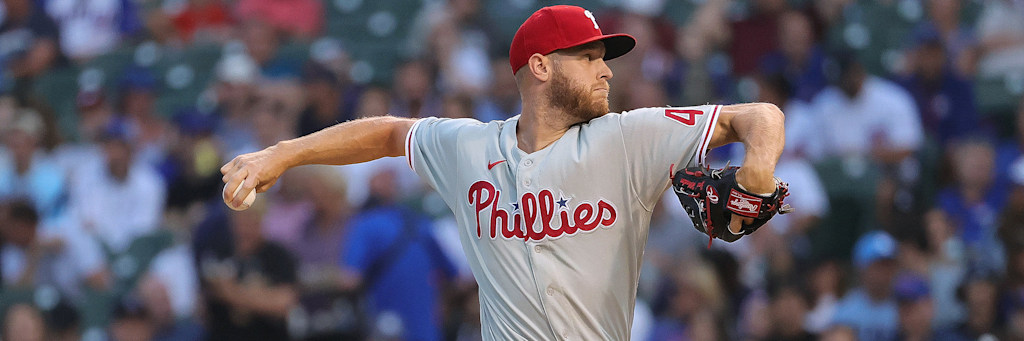
Nine strikeouts. One earned run allowed. And a loss, because Max Muncy hit a two-run homer off Philadelphia's bullpen on July 21 and the Phillies offense couldn't scratch back. That is the box score that should worry nobody about Zack Wheeler, and it is also the exact kind of result a win-loss record hides. Wheeler takes a 10-2 mark into Miami on Monday, but the 10-2 is decoration. The 2.16 ERA and the 0.88 WHIP are the signal, and tonight he faces a Marlins roster that has scored enough to stay respectable in the standings without ever forcing anyone to fear its lineup card. That single matchup produces two separate positions on this board, and it is the clearest example of an idea that runs through all five plays below: the gap between the talent on the mound and the talent standing across from it is a bigger number than either team's record suggests.
The Framework: Pricing The Gap, Not The Record
Records get built on sequencing, bullpen luck, and thirty extra-inning coin flips no model can retroactively fix. What a record does not measure directly is the distance between a team's best asset on a given night and the equivalent asset across the diamond. A 55-49 team can still trot out a rookie who has walked sixteen batters in a twenty-inning stretch. A 49-55 team can still run out the rookie with the lowest ERA in baseball, and it will not matter to a team total bet because that pitcher throws for the other side of the inning. The model below isolates that gap on five separate boards: command against control, a front-line arm against a swingman, and twice, an offense that has shown this year it simply does not have the firepower to punish an average pitcher into a bad night.
Every number below was pulled from live season stat pages and cross-checked against a second box score or recap before it went into a projection. Two plays come from the same start, tied together deliberately rather than treated as independent.
| Pitcher | ERA | WHIP | IP | K | Faces |
|---|---|---|---|---|---|
| Gerrit Cole (NYY) | 3.92 | 1.10 | 62.0 | 66 | White Sox |
| Noah Schultz (CWS) | 6.00 | 1.36 | 38.2 | - | Yankees |
| Kyle Bradish (BAL) | 3.49 | 1.35 | 107.1 | 106 | Tigers |
| Slade Cecconi (CLE) | 4.60 | - | 103.2 | 82 | Reds |
| Zack Wheeler (PHI) | 2.16 | 0.88 | - | 117 | Marlins |
Play One: Yankees Run Line -1.5
New York carries a 59-46 record into Chicago. The number tracked into this card, Yankees -1.5 at minus 360, sits well shorter than the plus-money price the public DraftKings board was still showing on the same spread Monday morning, a gap wide enough to flag on its own. Line movement between books at different limits is normal, and this is the number in play, not a market snapshot. What it is not fully pricing in is what has actually happened the last three times Cole took the mound. He has lost three straight starts, allowing eight earned runs across 19.1 innings, including three runs in seven innings against Pittsburgh on July 22 and two runs in six against the Dodgers on July 17. His season lines, a 3.92 ERA and a 1.10 WHIP with 66 strikeouts in 62 innings, are still elite process numbers even through the rough stretch, a 9.6 strikeouts-per-nine rate with a walk total in the low teens.
Across from Cole is exactly the kind of pitcher a bet like this is built to find. Noah Schultz, Chicago's top pitching prospect, has fought his control all season. He walked 22 batters in 38.2 innings through his first eight starts, four or more walks in four of six outings during his worst stretch, and at one low point put up sixteen free passes across a twenty-inning window that pushed his ERA to 6.00 through his first ten big-league starts. He has cleaned it up lately, no walks in his last two outings covering 8.2 innings, and that improvement is the honest counterpoint here. If Schultz has actually turned a corner, a rookie who dominated the minors can be sharp enough to keep this margin under 1.5 runs even in a loss. But two clean starts is a small sample against a season of wildness, and Cole's command floor, even in a slump, is higher than Schultz's ceiling has shown in the majors. The gap in swing-and-miss stuff and strike-zone control between these two arms is the widest on the board tonight.
Play Two: Detroit Tigers Team Total Under 4.5
Detroit's offense authored one of the sharper turnarounds in the league over a 33-game stretch, hitting 60 home runs compared to 25 in the 33 games before it, and that power binge is a real thing that happened. It is also not what showed up on July 25, when the Tigers managed two runs on a Hao-Yu Lee homer and lost to Kansas City, their offense going quiet again in the middle of a stretch the beat writers are already calling a bounce-back-or-bust week. Detroit sits at 50-56, scoring 4.20 runs a game across the full season, a number that includes both the power surge and the droughts bracketing it.
Kyle Bradish is the reason this projects as an under rather than a coin flip. He carries a 3.49 ERA into the start and has thrown a quality start in each of his last three July turns, a real form spike for a pitcher two years removed from Tommy John surgery. Comerica Park does not fight the bet either. Its outfield plays deep enough, 420 feet to straightaway center, that if the diamond were split into thirds, center field would be the hardest section in baseball to clear, and the park has graded as pitcher-neutral to slightly pitcher-favorable most of this year. The honest risk is that Detroit's power surge is not a mirage. If the Tigers are actually a different offense than the one that hit six homers in May, one mistake pitch from Bradish erases this number in a single swing, and that risk is why this sits at a lean stake rather than a max one.
Play Three: Cincinnati Reds Team Total Under 4.5
Cincinnati has the most talented arm on this entire board on its own roster and it will not throw a single pitch in this game. Chase Burns, the Reds' rookie right-hander, carries a 2.54 ERA with 191 strikeouts and an All-Star selection, the lowest ERA by any rookie in baseball this year, and the Reds are still 49-55, seventeen and a half games back in the NL Central. That contradiction is the whole story of this offense. It cannot support even its own ace.
The counterpoint here is real and it is the reason this is the smallest bet on the slate. Slade Cecconi is not a suppression arm. He carries a 4.60 ERA and has walked his share of hitters across 103.2 innings, and Great American Ball Park is one of the best home run parks in the sport, second only to Coors Field in overall park factor even if its non-homer offense grades closer to average. A pitcher this hittable, in a park this small, would normally be an over signal on its own. The only reason the under still clears the model's filter is that Cincinnati's bat-to-ball problem is severe enough, dead last in batting average across all thirty teams, that even a mediocre arm has proven capable of shutting this lineup down. It is a thin edge stacked against a real park risk, which is exactly why the stake reflects it.
Plays Four And Five: Wheeler Against A Swingman In Miami
Two positions come out of the same start, and both trace back to the same fact: Zack Wheeler is a different pitcher than the man on the mound across from him. Wheeler's 2.16 ERA and 0.88 WHIP are the best command numbers of any starter working Monday, and since returning from the thoracic outlet surgery that ended his 2025 season, he has been even sharper in the small sample that matters most right now, a 2.55 ERA and a 0.93 WHIP with 22 strikeouts against six walks over his last four turns. At home this season he is 4-1 with a 2.74 ERA. The July 21 line against the Dodgers, nine strikeouts and one earned run in a game his own offense lost, is as clean a demonstration of stuff outrunning results as any start on the calendar this month.
Miami's answer is Tyler Phillips, a pitcher who has bounced between the rotation and the bullpen this year and carries the scars of both roles into his season line, a 3.52 ERA and a 1.39 WHIP with two saves mixed into his 79.1 innings. His last month has been a coin flip start to start. He shut Seattle out over five innings on July 8, then lasted barely a frame in relief against Cleveland on July 12, giving up two earned runs, then got knocked around for five runs across 3.1 innings against Oakland before that. That volatility is the definition of a replacement-level arm keeping a rotation spot by matchup rather than by dominance, and it is what the Phillies moneyline is really pricing, not just Wheeler's talent but the absence of a stabilizing presence on the other side.
The honest counterpoint on both plays is the same one. Wheeler has now lost three of his last five decisions despite the ERA, because his own offense has been streaky behind him, and if that pattern holds in reverse, a Marlins lineup that has been competitive enough to sit five games over .500's mirror image, 52-54, could scrape together a couple of unearned or bullpen-driven runs even in a Wheeler start. He is not unhittable, he is excellent, and excellent starters still occasionally allow three or four runs on a mistake-pitch night. Treat these two plays as one opinion on Wheeler holding his current form, not two independent edges, and size accordingly.
Sizing And The Ledger
Nine and a half units are out across five positions tonight, weighted by how wide the talent gap actually is rather than by how confident the storyline sounds. The Yankees run line carries the largest stake because the command gap between Cole in a slump and Schultz in his first full season is still the widest one on the board, verified by a walk-rate history that has only just started to trend the right way. The Wheeler plays are sized as a connected 2.5-unit view, not two separate five-star locks, because both live and die on the same pitcher holding the same form. The Tigers play gets a lean stake because Detroit's power surge is real enough to punish a mistake. The Reds team total is the smallest position on the board on purpose, a bet on a historically bad batting average holding up against a pitcher who does not belong in this sentence next to Chase Burns.
Every figure above, records, ERA, WHIP, walk totals, wRC+, and park factors, was pulled from live season data and recap coverage this morning and reconciled against a second source before these projections were finalized. Nothing here is a memory of what these pitchers used to be. It is what they have actually done through their last outing.