MLB Picks, July 30, 2026 | Team total under
The Streak Discount Model: Three Plays On Pricing A Hot Week
Published July 30, 2026 | Daily Model Breakdown | MLB Prediction Data Lab
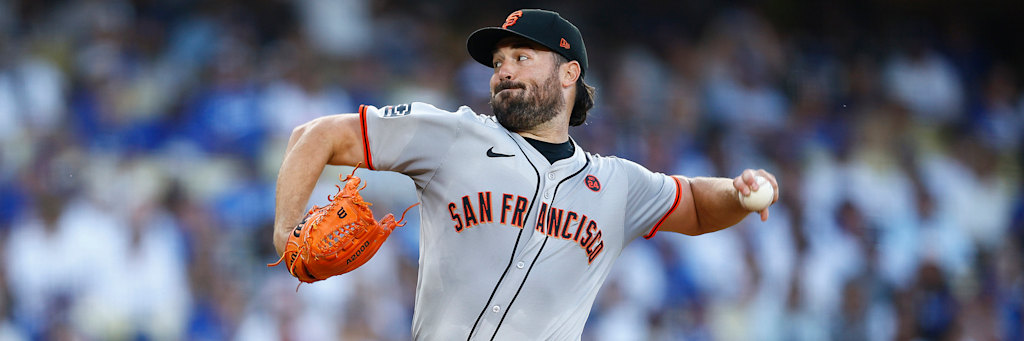
Two streaks arrive at Petco Park tonight, and the market has chosen to price exactly one of them. San Diego has won five straight games, so the Padres are favored and the 46-62 Giants are +1.5 underdogs at -155, one night after San Francisco scored sixteen runs on a 67-41 Brewers team. The question the model asks in this spot is narrow and quantitative: how much predictive weight does a five-game window deserve against a 108-game baseline? The answer it keeps returning, across every backtest of this season, is far less than the market assigns. San Diego's four months of scoring evidence say bottom-seven offense. The last five days say juggernaut. Tonight's entire board, five and a half units across three positions, is a bet on which of those samples tells the truth.
The Framework: A Five-Game Sample Moves A Projection By Decimals, Not Runs
The Padres have scored 27 runs during their five-game winning streak, 5.4 per game. Their season rate is 4.19, built from 453 runs across 108 games, and only six teams in baseball have scored fewer. When a five-game surge gets blended into a 108-game baseline at anything close to honest proportions, the projection barely moves. The math is unforgiving: five games is 4.6 percent of the sample. The recent hot stretch also came against Miami and a Colorado staff that has allowed more runs than any team in the sport, which means opponent adjustment strips out most of what little signal the window contained. Pitching form is different, and the model treats it differently. A starter's last six turns reflect current pitch shape, velocity and health in a way a lineup's last five box scores do not. That asymmetry, discount hitting streaks, respect pitching form, is the entire architecture of tonight's card.
Every number below was pulled this morning from live league schedule and stat feeds, then cross-checked against a second source before entering a projection.
| Pitcher | Team | Record | ERA | WHIP | IP | K | Faces |
|---|---|---|---|---|---|---|---|
| Robbie Ray | SF | 9-6 | 3.16 | 1.31 | 116.2 | 101 | Padres |
| JP Sears | SD | 3-3 | 3.86 | 1.18 | 28.0 | 23 | Giants |
| Sonny Gray | BOS | 12-2 | 2.78 | 1.16 | 106.2 | 93 | Athletics |
| Mason Barnett | ATH | 1-1 | 4.74 | 1.38 | 24.2 | 23 | Red Sox |
Positions One And Two: The Giants, Twice, Against A Five-Inning Ceiling
JP Sears has made five starts this season and has not completed six innings in any of them. His longest outing was 5.2 innings on June 24, his per-start average sits below five innings, and his last appearance was a 3.1-inning relief stint on July 25. He has also allowed five home runs in 28 total innings, a rate north of 1.6 per nine. Structurally, a Sears start hands the opposing lineup two distinct scoring windows: the starter window, where the home run rate does the work, and the middle-relief window, which opens in the fifth or sixth inning every single time he pitches. The model expresses that structure twice. The Giants team total over 3.5 at -125 needs four runs across both windows from a lineup that has scored four or more in four of its last eight games, including sixteen last night, when Heliot Ramos and Luis Arraez each went four for five and Daniel Susac homered twice. The run line at -155 needs San Francisco to stay within one, with the model's projected game script, low Padres total, reachable Giants total, making an outright win the modal outcome.
The candor: San Francisco is 20-35 on the road, the worst kind of team to trust at a -155 price, and Petco suppresses exactly the fly-ball contact the over needs. If Wednesday's sixteen-run night was the anomaly a 46-62 record suggests, both positions lose to the same quiet lineup. The model is aware it is holding Giants exposure in a park that hates hitters. It holds it anyway, because the alternative is pretending a five-inning starter is a six-inning one.
Position Three: Red Sox Moneyline, Paying The Chalk Price
Laying -175 requires a 63.6 percent break-even, the steepest hurdle on tonight's card, and this is the one spot where the model pays it. The inputs stack one direction. Sonny Gray is 12-2 with a 2.78 ERA and a 1.16 WHIP, and before Toronto reached him for five runs on Saturday he had rattled off five consecutive starts allowing one earned run or none, including 7.1 scoreless one-hit innings against the Yankees on June 28. The Athletics have allowed 604 runs, more than every team in baseball except Colorado, an average of 5.59 per game. Their listed starter, Mason Barnett, has not started a game all season, carries a 4.74 relief ERA, and was stretched to 3.1 innings and 54 pitches on Saturday in obvious preparation for tonight. Boston is 56-51 with a 31-22 road record and has won two of the first three in this series. A 12-2 starter against a first-start-of-the-year bullpen assembly, backed by a seven-of-ten form line, prices out above 70 percent in the simulation, and the gap between 70 and 63.6 is the edge.
Sutter Health Park is the counterweight. The Athletics' temporary home inflates offense, Gray is coming off his worst start of the season, and Tuesday's 4-3 Oakland win in this same series is a live demonstration that a bullpen-built pitching plan can cover nine innings. Chalk at -175 loses often enough to humble any model. The sizing reflects the price, not doubt about the read.
Sizing And The Ledger
Five and a half units across three positions, two of them concentrated in a single game at Petco. Concentration is usually a flaw. Here it is the thesis: Giants-Padres is the game where the market's recency premium is largest, a five-game streak priced against a sixteen-run night as if the streak is signal and the sixteen runs are noise, when the season-long data argues both are noise and the pitching mismatch is the only durable fact in the matchup. Ray in his last six starts has been one of the best run preventers in baseball. Sears has never seen the seventh inning this year. Every other number on the board orbits those two.
Each figure in this breakdown, records, ERAs, innings totals, home and road splits, run totals and the game logs behind them, was pulled from live schedule and statistics feeds this morning and verified against a second source before publication. The model does not remember what these teams looked like in April. It measures what they are now, and it discounts what they were last week.