MLB Picks, July 24, 2026 | Team total under
The Run Environment Model: Seven Friday Prices Where One Lineup Is Isolated At A Time
Published July 24, 2026 | Daily Model Breakdown | MLB Prediction Data Lab
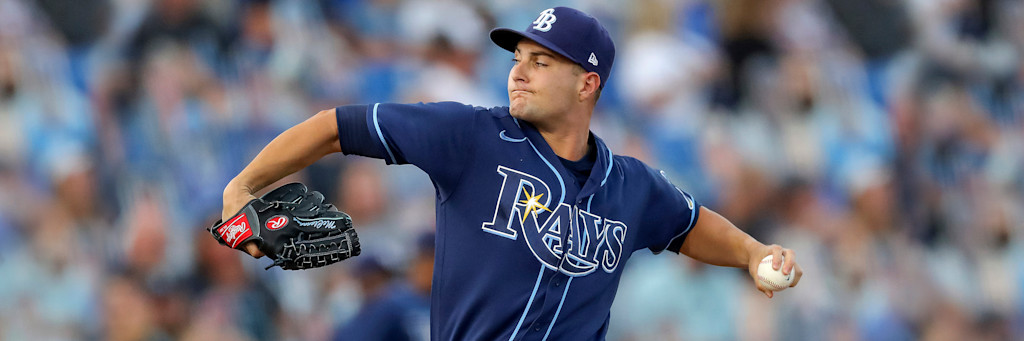
A moneyline projection has to model two run distributions and then integrate over every way one can exceed the other. A team total models exactly one. It asks a single question, how many runs will this lineup score against this staff in this park, and it discards the opposing offense entirely. That narrowing is why the model's highest-confidence outputs on the Friday board are not sides at all. They are two team totals, and both of them are unders.
The Framework: Expected Runs Before Anything Else
Every play below starts from a single projected number, the expected runs for one lineup against the arm it faces, shrunk toward league average by the size of the pitcher's sample. For a team total that projection is the whole bet. For a moneyline or a first five innings price it becomes one half of a run-differential model, and for a full game total it is the sum of two lineup projections. Isolating the lineup first, then rebuilding upward, keeps the noisiest term, bullpen sequencing in the late innings, from contaminating the cleaner starter-driven signal.
Four of tonight's projections clear a meaningful edge over the posted number. Two are team totals, one is a first five innings side where the starter gap dominates, and one is a plus-money side the market has mispriced by anchoring on the opposing ace. The table below is the model's starter input sheet, and every figure was pulled from the league data feed this morning and reconciled against the day's confirmed probables before the projections ran.
| Starter | ERA | WHIP | IP | K | Faces (lineup) |
|---|---|---|---|---|---|
| Shane McClanahan (TB) | 3.16 | 1.15 | 91.0 | 85 | Cleveland |
| Bryce Miller (SEA) | 2.27 | 0.88 | 63.1 | 71 | Texas |
| Joey Cantillo (CLE) | 3.74 | 1.42 | 106.0 | 112 | Tampa Bay |
| Dustin May (STL) | 4.78 | 1.32 | 98.0 | 95 | Cincinnati |
| Logan Webb (SF) | 3.87 | 1.11 | 107.0 | 85 | Los Angeles (AL) |
| Jacob Lopez (ATH) | 6.64 | 1.73 | 59.2 | 49 | Minnesota |
Play One: Cleveland Team Total Under 3.5, Minus 122
A -122 price on Cleveland scoring under 3.5 runs demands a 55.0 percent hit rate. The model projects the under at 60.1 percent, and the entire edge comes from a collision of two facts on the same side of the ledger. Cleveland has scored 417 runs on the year, one of the three lowest offensive outputs in the league, and tonight the Guardians face McClanahan's 3.16 ERA and 1.15 WHIP. A lineup that already produces below the mean, matched against a strikeout arm keeping the bases clear, projects to an expected 3.05 runs across the game.
Shrinkage is the honest limit here. McClanahan is not a nine-inning pitcher, and once he departs the projection hands the remaining innings to the Tampa Bay bullpen, which is a higher-variance input than the starter himself. The model accounts for that by capping the stake below what the raw edge would suggest, but the direction is unambiguous. A quiet offense against a quality arm is the single most reliable under profile in baseball.
Play Two: Texas Team Total Under 3.5, Minus 118
This projection rests almost entirely on one input, and it is the lowest WHIP on the board. Bryce Miller has allowed 0.88 baserunners per inning across 63.1 frames behind a 2.27 ERA. Runs are a function of baserunners, and a pitcher who permits fewer than one an inning structurally caps the number of scoring sequences a lineup can build. Texas has scored 427 runs, a league-average output, and the model projects the Rangers at an expected 3.10 runs, which puts the under at 58.4 percent against a 54.1 percent break-even.
This stake is a full unit smaller than Cleveland's for a specific reason the model refuses to ignore. Miller has thrown only 63.1 innings, roughly two-thirds of a normal starter's workload to this point, which means his projection carries a wider confidence interval and his outing length is more likely to be managed short. A shorter start hands more innings to the bullpen and widens the run distribution. The edge is real, the sample is thin, and the sizing reflects both.
Play Three: Guardians-Rays Under 7.5, Minus 115
Stacking the two lineup projections in the Tampa game produces a full-game total below the posted 7.5. Cantillo faces the Rays at a 3.74 ERA and a 112-strikeout rate over 106 innings, McClanahan faces the Guardians, and both staffs carry team ERAs under 3.85, at 3.71 for Cleveland and 3.83 for Tampa Bay. The summed projection lands at 7.0 runs, which puts the under at 55.6 percent against a 53.5 percent break-even.
That narrower edge, relative to the Cleveland team total, is a direct consequence of the wider input. Tampa Bay has scored 459 runs, well ahead of Cleveland, so the Rays half of the total carries real upside that the Guardians half does not. The model treats this as a supporting position at 1.5 units rather than a headline play, and it correlates with the Cleveland team total because both live in the same game. Size the pair as one opinion about run scoring in that park tonight.
Play Four: Cardinals Moneyline, Minus 159
Rebuilding a full run-differential model for the Cardinals game produces a comfortable favorite. Dustin May projects better than his 4.78 ERA once the opposing lineup is accounted for, because Cincinnati has scored 423 runs and sits at 47-54, while St. Louis carries a 4.18 staff ERA against the Reds at 4.56. The opposing starter is the swing input: Rhett Lowder's 5.75 ERA and 1.64 WHIP over 72 innings model as a below-replacement run-prevention profile, and his walk rate specifically feeds the Cardinals offense extra baserunners at home.
This projection's ceiling is capped by the reality that neither club is a strong team. Both are within two games of .500, May is a mid-rotation arm rather than an ace, and a single start can swing on three or four batted-ball outcomes. The edge is genuine and the direction is clear, but the model reads this as a solid favorite, not a lock, and stakes it accordingly.
Play Five: Giants First Five Innings, Minus 175
First five innings is the market where a starter-driven model has its cleanest expression, because it settles before the bullpens enter and removes the single noisiest term from the projection. Logan Webb faces the Angels at a 3.87 ERA and a 1.11 WHIP, and across from him Grayson Rodriguez carries an 8.23 ERA across only eight starts in his first season back from elbow surgery, having been acquired from Baltimore last November in the Taylor Ward trade. The Angels have allowed 500 runs, the most of any club on the slate.
Working against it is the Giants offense, which has scored 417 runs and must produce against a live arm before the game breaks open. The first five projection still clears the number because the starter gap is the widest on the board and the market it settles in strips out relief variance entirely. The stake is the largest on the card for exactly that reason: the input driving it is the least contaminated projection available tonight.
Play Six: Athletics-Twins Over 9.5, The One Over
This run-environment model produces exactly one over on the Friday board, and it produces it loudly. Jacob Lopez brings a 6.64 ERA and a 1.73 WHIP for the Athletics, whose staff has allowed 580 runs, the most in the league by a wide margin, while Zebby Matthews answers with a 5.40 ERA and 15 home runs surrendered in only 70 innings. Minnesota has scored 498 runs, the healthiest offense on the slate, and the summed lineup projection lands at 10.4 total runs.
Single-game totals carry more variance than team totals because both lineups must perform, and a quick hook or a cold night collapses the projection. The model accepts that risk here because the home-run rates on both starters are extreme and the bullpens behind them, at 5.39 and 4.71 team ERAs, offer no relief. The direction is as clear as any under on the card, pointed the opposite way.
Play Seven: Yankees Moneyline, Plus 122
This final position is a market-mispricing play rather than a pure projection edge. New York carries a 3.38 team ERA and has allowed 392 runs, both the best marks on the board, yet sits at +122 as a road underdog. The reason is Jesus Luzardo, whose 3.43 ERA and 143 strikeouts over 115.1 innings have pulled the price toward Philadelphia. The model still makes the Yankees a slight favorite on roster strength, and a plus number only needs to cash 45.0 percent of the time.
Cam Schlittler's 2.20 ERA over 123 innings means the Yankees are dogs in spite of holding the sharper arm, not because of a weaker one. This is a bet that the market has over-adjusted for a single strong starter and under-weighted the run-differential gap across the full roster. One unit is the correct size for an edge that is real but rests on a matchup the projection itself flags as close.
Sizing And The Ledger
Seven positions, twelve and a half units, and one correlation to respect: the Cleveland team total and the Guardians-Rays under share a field, so treat them as a single four-unit opinion about run scoring in Tampa rather than two independent edges. The remaining five resolve on their own.
Stakes track edge magnitude adjusted for the width of each projection's confidence interval. The Giants first five carries the top stake because it settles before the bullpens and the starter gap is enormous. Cleveland's team total is next, a below-mean offense against a strikeout arm. The Cardinals side and the Athletics-Twins over take intermediate stakes, and the two thinnest-sample or closest projections, the Texas under and the Yankees plus price, take a single unit apiece.
Every figure above was pulled from the official league data feed on the morning of July 24 and reconciled against the confirmed probable starters before the model ran. Records, staff ERAs, run totals and starter lines matched across sources, and the Grayson Rodriguez acquisition and start assignment were confirmed directly rather than inferred.