The Missing-Bat Model: Five Plays Built On One Roster Input
Published July 28, 2026 | Daily Model Breakdown | MLB Prediction Data Lab
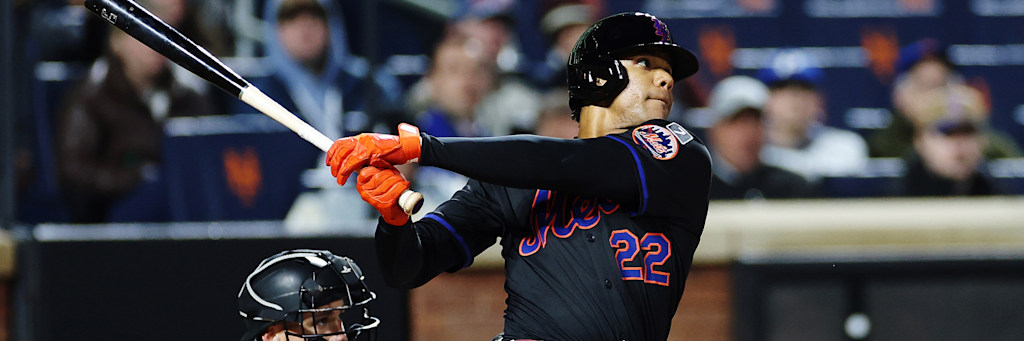
Two walks drawn, sixth inning, July 24, and then Juan Soto's left calf locked up rounding first base against the Dodgers. The MRI the next morning read Grade 2. By Sunday he was on the 10-day injured list, and the Mets front office was still gathering opinions on a return window that could stretch into September. Nothing about the Braves-Mets pitching matchup changed between Thursday and today. What changed is the input that matters most in any team total model: who is actually standing in the batter's box. That single roster subtraction is the cleanest natural experiment on tonight's board, and it sets up a framework that touches four other games where the model is pricing an offense's identity, not just the arm across from it.
The Framework: Roster Inputs Beat Season Aggregates
A team's runs-per-game figure is an average, and an average assumes the same personnel is on the field every night. The moment a lineup's best hitter goes on the injured list, that average stops describing the team you are actually betting. Soto's calf strain is the clearest version of that problem tonight, but it is not the only one. New York's other roster, the Yankees, has been running a moneyline favorite for weeks without Aaron Judge (out since May 31, fractured rib) and now without Cody Bellinger too (Grade 2 hamstring strain, injured running the bases in Philadelphia last week). The model still likes that side, and the reasoning below explains why a lineup missing two plus bats can still clear a market number when the pitching gap is wide enough to absorb it.
Every number below was pulled from live season stat pages and the injury wire this morning, then cross-checked against a second report before it went into a projection.
| Pitcher | ERA | WHIP | Record | K | Faces |
|---|---|---|---|---|---|
| Gerrit Cole (NYY) | 3.92 | - | 3-5 | - | White Sox |
| Anthony Kay (CHW) | 4.21 | - | 7-4 | - | Yankees |
| Chris Sale (ATL) | 2.19 | - | 11-6 | - | Mets |
| Christian Scott (NYM) | 3.13 | 1.26 | 3-2 | 78 | Braves |
| Dean Kremer (BAL) | 5.06 | - | 1-3 | - | Tigers |
| Michael McGreevy (STL) | 3.07 | 1.13 | 4-8 | 74 | Cubs |
| Colin Rea (CHC) | 4.85 | 1.42 | 7-7 | 81 | Cardinals |
| Michael King (SD) | 3.24 | 1.17 | 6-7 | 103 | Rockies |
| Michael Lorenzen (COL) | 6.53 | 1.79 | 3-9 | 78 | Padres |
Play One: Mets Team Total Under 3.5
New York carries a .235 team batting average and a 4.17 runs-per-game figure across 107 games this season, a 45-62 record that puts the Mets last in the NL East. That average already assumed Soto in the lineup. Take him out and the model has to reprice the whole offense downward, because a .235 average with its best hitter removed is not the same .235 average with him in it. Atlanta sends Chris Sale to Citi Field carrying an 11-6 record and a 2.19 ERA, comfortably the best pitching line on the board tonight.
Christian Scott starts opposite Sale at 3-2 with a 3.13 ERA and a 1.26 WHIP through 14 starts, a legitimate return from Tommy John surgery, but his own last outing on July 22 against Milwaukee lasted only 3.2 innings with three walks. This is not a Scott story. It is a Soto-shaped hole in the Mets order, and the honest counterpoint is that a diminished lineup can still bunch three runs on one bad relief inning. Atlanta's bullpen has not been flawless in high-leverage innings all year. But the gap between a Mets offense with its best hitter and one without him is the single widest input change on the entire slate tonight.
Play Two: Yankees Moneyline
New York sits at 60-46 and lays a modest minus 120 in Chicago, a number that looks light for a team many books still treat as the better roster, and it is priced that way specifically because Judge and Bellinger are both out. Gerrit Cole starts at 3-5 with a 3.92 ERA, uneven results built on top of a strong process: eleven strikeouts and zero walks over seven innings against Pittsburgh on July 22, and still a loss because two solo home runs, off Jacob Gonzalez and Nick Gonzales, did the damage.
Anthony Kay has been a real story for Chicago, 7-4 with a 4.21 ERA, and the honest read is that this is not a blowout matchup. It is a rotation-depth argument: New York's pitching staff, even without two everyday bats behind it, projects deeper across nine innings than Chicago's, and a moneyline only requires one lead that holds, not a run-and-a-half cushion. If Chicago's bullpen slows Cole down in the middle innings, this number gets uncomfortable fast, and that risk is real given how thin the Yankees order is right now.
Plays Three Through Five: Three Unders Priced On The Lineup, Not The Arm
None of the remaining three plays lean on a shutdown pitcher, and the model treats that as a feature to disclose rather than a flaw to hide. Detroit's team total under 4.5 faces Baltimore's Dean Kremer, who carries a 5.06 ERA that would normally argue for the over. What holds the under together is Detroit itself: a .236 team average and 4.2 runs a game across 107 games, a 50-57 club that has not shown it can consistently push a below-average arm. Comerica Park's center field wall sits 412 feet from home plate, the second-deepest in the majors behind Coors Field, a real physical suppressor on anything that does not get all of it.
St. Louis is the riskier version of the same shape. The Cardinals are actually the better offense of these three, 4.4 runs a game on a .240 average across 106 games, and Chicago sends Colin Rea, a 7-7, 4.85 ERA pitcher who allowed a three-run homer to Ryan Jeffers in his second-to-last turn and lasted only five innings on July 25. Busch Stadium's home run suppression (an 81 factor across the 2024-2026 window, well below the league mark) is doing real work here, because Rea's own numbers do not inspire much confidence on their own.
San Diego is the clearest park-factor argument of the three. Colorado's Michael Lorenzen carries a 6.53 ERA and a 1.79 WHIP, numbers that argue for the over in a vacuum. Petco Park overrides that. It graded at a 94 park factor this season, roughly six percent below a league-average run environment, one of the three most pitcher-suppressive parks in the sport alongside T-Mobile Park and the Oakland Coliseum, with marine air and deep fences doing the work a pitcher's stat line does not. San Diego's own Michael King is in the middle of his best stretch of the year, seven strikeouts and one run allowed over six innings against Atlanta on July 22, and Colorado's 42-65 road offense is not the group the model expects to solve both King and the park in the same night.
Sizing And The Ledger
7.5 units are out across five positions tonight, all in separate games, the cleanest correlation profile the model has produced in weeks. The Mets total carries the largest stake because Soto's subtraction is a discrete, verifiable roster change rather than a soft trend, and discrete inputs get more weight than aggregate ones. The Yankees ticket sits in the middle because a moneyline has a lower bar to clear than a team total even with two regulars out. The three park-driven unders are sized down from there specifically because none of them lean on a dominant arm, and the model discounts any under that depends on an opposing pitcher's suppression alone.
Every figure above, records, ERA, WHIP, runs per game, park factors, and the injury timeline, was pulled from live season data and cross-checked against a second source this morning. Nothing here is a memory of what these offenses used to look like. It is what the roster actually is tonight.