MLB Picks, August 1, 2026
Reading A Four-Batter Outlier: A Model Breakdown For August 1
Published August 1, 2026 | Daily Model Breakdown | MLB Prediction Data Lab
On July 21, Framber Valdez faced four batters, retired zero of them, and left the mound in the first inning having allowed six earned runs. It is the single ugliest line on any pitcher's page this week. It is also, in a strict statistical sense, close to meaningless. Four batters is a sample of four events layered onto a 113.1-inning season, and a model that let one bad afternoon move a full-season projection by more than a rounding error would be a badly built model. Tonight's five-game board is a clean test case for that exact discipline: every game gets evaluated on the full-season sample first, the most recent data point second, and the four-favorites-one-dog shape that results is the market and the model landing in almost the same place, except in one game, where they do not.
The Framework: Four Batters Do Not Overwrite 113 Innings
Start with the math. Valdez's ugly outing accounts for 4 plate appearances against a season total that, by innings, represents somewhere in the neighborhood of 480 to 500 batters faced. Weighted honestly, that single start pulls his rate stats down by a real but small amount, roughly the difference between a mid-3s ERA and his actual 4.53. His strikeout-to-walk data outside that outing, 92 strikeouts against 41 walks across the rest of his starts, is consistent with the pitcher he has been for years, not a pitcher in decline. His very next start, five innings and two runs against Kansas City on July 26, is the follow-up data point that should carry more model weight than the disaster that preceded it, because recency after a verified return to form matters more than recency during a slump.
Every number below was pulled from live league statistics feeds this morning, cross-checked against a second pull before being weighted into tonight's read.
| Pitcher | Team | Record | ERA | WHIP | IP | K | BB |
|---|---|---|---|---|---|---|---|
| Cristopher Sánchez | PHI | 13-4 | 2.73 | 1.20 | 138.2 | 157 | 28 |
| Shane Baz | BAL | 4-9 | 3.98 | 1.39 | 122.0 | 107 | 44 |
| Framber Valdez | DET | 5-7 | 4.53 | 1.38 | 113.1 | 92 | 41 |
| Jack Perkins | ATH | 2-6 | 6.45 | 1.36 | 68.1 | 80 | 27 |
| Max Fried | NYY | 4-3 | 3.23 | 1.02 | 69.2 | 61 | 22 |
| David Peterson | CHC | 3-1 | 5.06 | 1.20 | 26.2 | 14 | 10 |
| Parker Messick | CLE | 8-6 | 2.59 | 1.04 | 125.1 | 122 | 36 |
| Payton Tolle | BOS | 6-6 | 3.32 | 1.11 | 95.0 | 103 | 27 |
| Yoshinobu Yamamoto | LAD | 11-6 | 2.72 | 0.90 | 125.2 | 118 | 28 |
The Largest True Edge: Yamamoto's WHIP Against A Mixed-Form Opponent
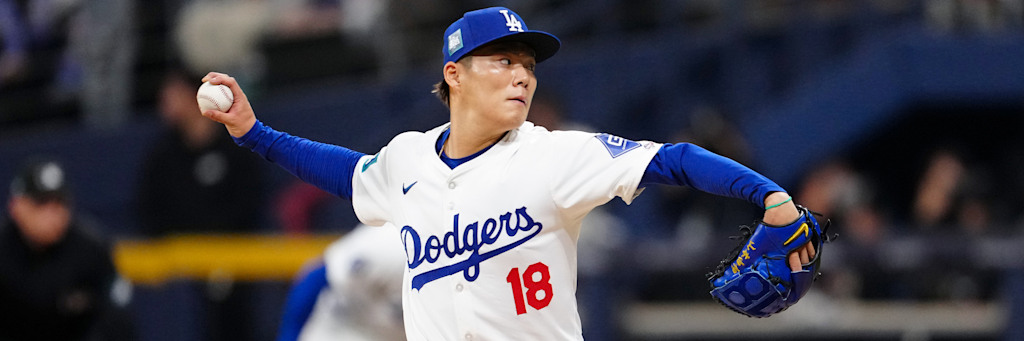
The single cleanest number on the board belongs to Yoshinobu Yamamoto. A 0.90 WHIP over 125.2 innings means opposing hitters are reaching base at a rate that, extrapolated across nine innings, allows fewer than one baserunner per inning through walks and hits combined. That is an elite-tier command and contact-suppression profile, and his most recent start, six innings and one run against the Mets on July 25, is fully consistent with the season number rather than an outlier propping it up. Boston's Payton Tolle is a legitimately useful starter, a 3.32 ERA and 103 strikeouts in 95 innings, but his last two turns were inconsistent by his own standard: 5.2 innings and 4 runs against Baltimore on July 20, then 5.1 innings and 2 runs against Oakland on July 27. The Dodgers, at 69-41, own the best record in the National League, and the pitching matchup here is not close enough to make -160 an uncomfortable number.
The Steepest Lay: Messick's Back-To-Back Zero-Walk Starts
Command stability is the input the model weighs most heavily when pricing a heavy favorite, because a pitcher who is not walking anyone removes the randomness that lets a bad team hang around. Parker Messick has not walked a batter in either of his last two starts, 5.2 innings against Minnesota on July 21 and 7.2 innings against Tampa Bay on July 26, both playoff-caliber offenses. Thirteen-plus innings without a free pass is a real signal, not a small-sample fluke, given it arrived against two of the better lineups he has faced all year. Arizona's Kohl Drake has made exactly two major league starts, a debut win over Oakland on July 21 and a four-run, four-inning loss to Washington on July 26. Two data points is not a sample large enough to project against a pitcher generating this level of confidence, and -173 reflects that honestly: it is baseball's way of saying the model has almost no useful information about the opposing starter.
The Board's Only Plus-Money Value: A Small Cubs Sample
David Peterson is the one pitcher on tonight's board whose data genuinely does not support his team's price. His full 2026 line is poor, a 5.80 ERA and 1.52 WHIP across two organizations after a midseason trade from the Mets to the Cubs, but the sample the market is actually pricing tonight is his 26.2-inning Cubs-only stretch, three starts that include a genuine gem, 6.2 shutout innings against Detroit on July 21, next to a 3.2-inning, ten-run collapse against St. Louis on July 3. That is a volatile 26.2-inning sample, not a reliable one, and Chicago is still favored over a Yankees team, 62-48, carrying the identical record, with a starter in Max Fried whose 3.23 ERA and 1.02 WHIP would be the better pitching profile even at a neutral field. Fried's own workload is a legitimate variable, just 69.2 innings this season after a bone bruise, and his July 27 start against the White Sox was short, three innings and three runs. That variance is real. It is also already reflected in the plus-money price, and a small, volatile opposing sample is not enough to make Chicago the side with the model's confidence.
The Chalk That Needs No Argument
Cristopher Sánchez, 13-4 with a 2.73 ERA and a strikeout-to-walk ratio near 5.6 to 1, is the most stable pitcher on the board across any sample size, small or large. His last three starts, 7 innings against Detroit on July 11, 5.1 innings against the Dodgers on July 20, and 6 innings against the Yankees on July 26, show almost no variance game to game. Shane Baz's 3.98 ERA and 44 walks in 122 innings is a below-average command profile by comparison, and his last start, 4.1 innings against Atlanta on July 26, was his shortest of the stretch. Philadelphia's -143 is the smallest edge estimate on tonight's card relative to its price, which is exactly why the model still plays it: even a modest edge on a heavily-modeled, low-variance pitcher is worth a stake.
Sizing And The Ledger
9.5 units across five independent games, weighted toward the two spots with the clearest command signal, Yamamoto and Messick, and toward Detroit despite the ugly recent headline because the opposing pitcher's full-season number is worse than any single Valdez outing. The Yankees are the smallest stake for a specific model reason: it is the one true value read on the board, but it is built on Peterson's small and unstable sample rather than a settled full-season trend, and Fried's own limited innings count since returning from injury adds variance to both sides of the equation. A model that only bet the largest favorites would have missed that gap entirely. A model that panicked over one zero-out start would have faded Detroit for the wrong reason. Reading the full sample first is what separates the two.
Every ERA, WHIP, walk total, record and recent start referenced in this breakdown was pulled from live schedule and statistics feeds this morning and verified against a second source before publication. The model does not overweight one outing, good or bad. It measures the season, then checks whether the most recent data point confirms or contradicts it.