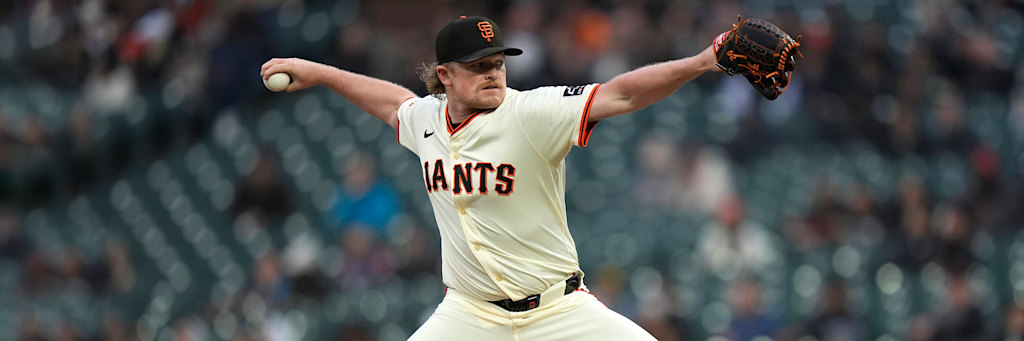
One game on the Saturday board sits at the intersection of every input the model weights most heavily, and it produces two outputs at once. Logan Webb takes the mound for San Francisco at Oracle Park carrying a 3.35 ERA and 70 strikeouts, a command-and-contact right-hander throwing in one of the most run-suppressing venues in the sport. That overlap of arm and park lets the model project both a Braves team total under 3.5 and a Giants win-probability edge from the same matchup. Around it sit two more run-prevention outputs: a Mariners Guardians game total under 7.5 and a Padres team total under 3.5 at Petco. The through-line is run expectancy, not the result.
The Framework: Park Factor, Ground-Ball Rate And Run Expectancy
A run-prevention projection answers a single question: how many runs can a single offense plausibly manufacture inside a specific run environment. Three inputs carry most of the signal. Park factor sets the baseline distribution, raising or lowering the expected run total before a pitch leaves the hand, and Oracle Park and Petco Park both sit near the bottom of the league in scoring. Ground-ball rate matters because a grounder carries a far lower run expectancy than a fly ball, especially in a marine-air park where fly balls already die on the warning track. Strikeout rate caps the ceiling, since a strikeout produces a run expectancy near zero. The Saturday board offers two starters who profile well on the first two inputs and two parks that do the rest, which is why the model lands on the unders and the low-scoring side ahead of any high-variance number.
Braves Team Total Under 3.5: The Highest-Conviction Output
| Team | Probable starter | Key inputs |
|---|---|---|
| Giants | Logan Webb (RHP, 4-5, 3.35 ERA, 70 K) | Ground-ball command arm in a pitcher's park |
| Braves offense | Atlanta, 49-31 entering the day | Strong road lineup facing park-plus-arm suppression |
The Braves team total under 3.5 is the model's top output, and the conviction comes from stacking two independent suppressors on the same offense. Webb is a ground-ball, command-first starter whose profile is built to keep run columns quiet, and Oracle Park is a venue that converts hard contact into long outs. A team total isolates exactly the variable the model can read cleanly, the Atlanta run column, and strips out the noise of how the Giants score on the other side. Atlanta is a 49-31 club with a genuinely dangerous lineup, so this projection is not built on a weak opponent. It is built entirely on the arm and the yard, the two cleanest inputs the model has, both pointing the same direction.
The model is transparent about the counterweight. A team total of 3.5 is a thin line, and a single swing that leaves even Oracle clears it before the bullpen ever appears, especially against a lineup as deep as Atlanta's. The other failure mode is an early Webb exit that hands innings to relievers who do not share his ground-ball profile. But the projection question is narrow: can a strong offense reach four runs against a quality ground-ball arm in the league's friendliest pitcher's park. The median says no, and because two suppressors agree, the model sizes this as its highest-conviction play on the board.
Giants Win Probability: The Same Matchup From The Other Side
| Item | Model detail |
|---|---|
| Matchup | Atlanta Braves at San Francisco Giants, 9:05 PM ET |
| Giants starter | Logan Webb (RHP, 4-5, 3.35 ERA, 70 K) |
| Braves starter | Bryce Elder (RHP, 5-5, 3.71 ERA, 79 K) |
| Records | Braves 49-31, Giants 33-48 |
| Model line | Giants moneyline -125 (DK Giants -132 / Braves +110) |
The same Oracle matchup produces a second output the market underprices: the Giants win probability. San Francisco is 33-48, so the moneyline of -125 looks counterintuitive at first glance, but the model does not weight standings, it weights the matchup. Webb at 3.35 against Bryce Elder, a competent but beatable 5-5 right-hander at 3.71, in a park that compresses every game toward a low-scoring grind, lifts the Giants win probability above what a record-driven line would suggest. When run scoring is suppressed for both sides, the team with the better starter on the mound wins a larger share of the close games, and that is the entire case.
The honest adjustment is the talent gap. Atlanta is the far stronger roster, and in a low-scoring game a 49-31 club can win 2-1 just as easily as the home side can. That is why the model treats this as a lighter win-probability edge rather than a featured play: the projected margin is thin, and the variance in a one-run game is wide. The Giants output and the Braves team total under are two reads on the same run environment, and the model sizes the win-probability side a notch below the team total because predicting the winner of a tight game carries a fatter tail than projecting a single run column.
Mariners Guardians Under 7.5: Two Average Offenses In A Pitcher's Park
| Team | Probable starter | Key inputs |
|---|---|---|
| Mariners | Logan Gilbert (RHP, 6-4, 3.29 ERA, possible piggyback Emerson Hancock 5-4, 3.60) | Front-line arm, lowest ERA on the board |
| Guardians | Slade Cecconi (RHP, 3-6, 4.48 ERA) | The loosest input, ERA near 4.50 |
The Mariners Guardians under 7.5 is the model's full-game total output, and the projection leans on the offenses as much as the arms. Seattle sits at 42-41 and Cleveland at 42-40, two .500 clubs with middling run production, and Progressive Field is a venue that historically holds totals down. Logan Gilbert is the cleanest arm on the slate at 3.29, which caps the Cleveland side firmly. The combined median for two average lineups in a pitcher-leaning park lands under 7.5, and the price tells the same story: at -120 on the under, the market is reading this as a true low-scoring lean rather than a coin flip.
The looser half of the projection is Slade Cecconi, and the model flags it plainly. A 4.48 ERA describes a starter capable of a multi-run inning, and that crooked frame is the single most likely path over the total. There is also the piggyback wrinkle, where Gilbert may give way to Emerson Hancock and his 3.60 ERA, turning the Seattle side into a two-arm script that widens the band. A full-game total stacks the variance of two run columns instead of one, which is why this ranks below the team-total outputs even though the model favors it. It is a directional read on park and offense quality, and the conviction reflects the wider distribution.
Padres Team Total Under 3.5: A Petco Read Against A Hot Offense
| Team | Probable starter | Key inputs |
|---|---|---|
| Dodgers | Yoshinobu Yamamoto (RHP, 7-5) | Front-line arm, deep bullpen behind him |
| Padres offense | San Diego, 43-37, on a four-game win streak | Hot bats in a strong pitcher's park |
The Padres team total under 3.5 is the model's park-driven output, and it requires the most nuance because the offense is hot. San Diego rides a four-game win streak into a home date with the 52-30 Dodgers, but a team total isolates only the San Diego run column, and that column sits inside one of the most run-suppressing parks in the sport against Yoshinobu Yamamoto, a front-line arm at 7-5. Layer the deep Los Angeles bullpen behind him, the unit that inherits any early exit, and the projected San Diego output compresses toward the low threes. The model weights park and pitcher quality over recent form here, which is why the under survives even against a streaking lineup.
The counterweight is exactly that streak. San Diego beat the Dodgers 7-1 on Friday, proof the lineup can post a crooked number on this same opponent, and at a -145 price one three-run inning ruins the play. That is why the model sizes this a step below the Braves anchor: the recent-form signal widens the distribution even as park and arm point under. The bet lives on the team total rather than a side because the run column is the only variable the model reads with confidence, and Petco plus a quality arm is the lowest-variance way to fade a hot offense.
The Full Projection Board
Sorted by the width of the projected edge and the variance of the bet type, the four run-prevention outputs line up in a clear order.
| Projection | Line | Primary input |
|---|---|---|
| Braves team total under | 3.5 | Webb command arm, Oracle park factor |
| Mariners/Guardians game total under | 7.5 | Two average offenses, Progressive Field, Gilbert 3.29 |
| Padres team total under | 3.5 | Petco park factor, Yamamoto quality |
| Giants win probability | ML -125 | Webb edge over Elder in a low-scoring park |
The order reflects distribution width, not preference. The Braves under sits on top because it folds two independent suppressors, a command arm and a pitcher's park, onto a single offense, the narrowest band on the slate. The Mariners Guardians under ranks high because the run-prevention inputs are strong even though a full-game total carries two run columns. The Padres under follows because a hot offense widens the band despite the park edge. The Giants win probability lands last among the four because predicting a winner in a one-run game inherits the fattest tail. The model favors each output, but favored is a probability, and the sizing tracks the spread.
How The Model Sizes Each Output
Conviction is a function of two things: the gap between the projection and the market line, and the variance of the bet type. Team totals are the lowest-variance outputs because they isolate one offense against one starter in one park, so the Braves under leads the board. The full-game total inherits a wider band from two run columns, which is why the Mariners Guardians under sits just behind despite strong inputs. The Padres under carries an added recent-form adjustment that widens its distribution. The Giants win probability is the highest-variance output here because a side bet in a low-scoring game can flip on one swing, so it earns the lightest lean. Across all four, the discipline is identical: project the run column, not the result, and let park factor, ground-ball rate and run expectancy set the distribution.
What Beats It
A single crooked inning beats the run-prevention board. The Braves under assumes Webb holds his ground-ball profile deep into the start; an early exit hands the run column to a different relief mix. The Padres under loses if the hot San Diego bats square Yamamoto before Petco and the bullpen intervene. The Mariners Guardians under is most exposed to a Cecconi blowup, the loosest input on the slate. The Giants win probability falls to the simpler truth that Atlanta is the better roster and can win the low-scoring game it is favored in. Lineups were not all confirmed at publication, so the projections assume listed regulars. The model is favored on its outputs, but favored is a probability, not a result.
Final Verdict
The June 27 projection model outputs the Braves team total under 3.5 as its anchor, driven by Logan Webb's ground-ball command and the Oracle Park factor, with the Mariners Guardians under 7.5 as the full-game read on two average offenses behind a 3.29-ERA Logan Gilbert, the Padres team total under 3.5 as the Petco park play against a hot offense, and the Giants win probability at -125 as the lighter side of the same Oracle matchup. The through-line is run prevention measured through park factor, ground-ball rate and run expectancy. For more model work, see the advanced stats hub, the latest projections, and the prediction archive.
Picks and odds come from the BetLegend daily tracker. Probable starters, records, matchups, and venues were verified against MLB Stats API data for June 27, 2026.
Related Projection Models
More daily run-prevention and run-suppression reads built on the same park-factor, ground-ball-rate and run-expectancy framework:
- June 26 run-suppression model: Cubs and Padres team total unders
- June 25 run-suppression model: Red Sox and Nationals team total unders
- June 24 run-prevention model: Twins under on Ohtani and an Orioles under
For the inputs behind every projection, read how the MLB prediction model works, and review the model's public track record and graded results.