Low-scoring baseball is not decided by how hard a lineup hits. It is decided by how often the opposing starter puts a runner on base, because a hitter cannot drive in a runner who never reaches. That single insight, expressed as WHIP, walks plus hits per inning pitched, is what carries both outputs on the July 9 model board. One arm on this slate is suppressing baserunners at a historic clip, and one arm is allowing them at a rate that a projection can exploit on the moneyline.
The Framework: Baserunners Before Barrels
Every run needs two events to exist, a runner reaching base and that runner being driven home. Season-long WHIP measures the first event directly, and it is a far more stable predictor over a single start than ERA, which swings on sequencing and defense. The model takes each starter's WHIP, converts it into an expected number of baserunners over a projected workload, applies a league-average conversion rate to estimate runs, and then compares that projection to the market number or the market price. The two outputs below are ranked by how far the projection sits from what the book is charging.
| Pitcher | WHIP | ERA | Record |
|---|---|---|---|
| Bryce Miller (SEA) | 0.66 | 1.71 | 4-2 |
| Framber Valdez (DET) | 1.38 | 4.29 | 4-6 |
| Janson Junk (MIA) | 1.30 | 4.80 | 3-5 |
| Jack Perkins (ATH) | 1.45 | 6.75 | 2-4 |
Output 1: Miami Marlins Team Total Under 3.5 (-120)
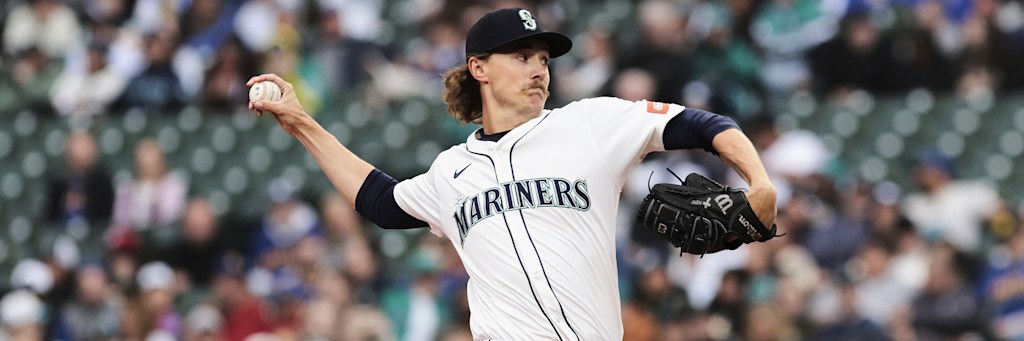
Bryce Miller's 0.66 WHIP is the anchor of the entire board. Across eight starts he has allowed fewer than seven baserunners for every nine innings, a suppression rate that leaves an opposing lineup almost no margin to sequence hits into runs. Projected over a six-inning start, that WHIP models to roughly four baserunners allowed, and a league-average conversion turns four baserunners into well under two earned runs. The Marlins offense is genuinely good, scoring 4.58 runs a game on a .254 average and a .742 OPS, but that production is a season-long blend against average pitching. It does not travel against a 0.66 WHIP. The model projects Miami's scoring distribution to land below 3.5 in a clear majority of simulations, which is the edge that clears a -120 price and a 54.5 percent break-even.
The venue reinforces the projection rather than fighting it. loanDepot Park depresses run scoring through a deep outfield and a fixed roof that removes the wind-aided carry other parks provide, so the model's park adjustment nudges the Marlins output down rather than up. Miami's own starter, Janson Junk at a 4.80 ERA and a 1.30 WHIP, raises the ceiling on the full-game total, but he has no effect on how many runs the Marlins bats generate, which is the only variable a team total under is exposed to. This is the cleaner of the two outputs because it depends on one dominant input rather than a two-sided comparison.

Output 2: Detroit Tigers Moneyline (-125)
The second output is a starter-versus-starter projection, and the gap is wide enough to matter. Framber Valdez brings a 4.29 ERA and a 1.38 WHIP into Comerica Park opposite Jack Perkins, whose 6.75 ERA and 1.45 WHIP represent a 2.46-run ERA differential, one of the larger single-game starter gaps on any recent board. The WHIP spread is narrower than the ERA spread, which is why the model treats this as a moneyline lean rather than a heavy play, but the direction is unambiguous: Valdez has thrown 100.2 innings across 18 starts and models as a stable six-plus-inning input, while Perkins has only 54.2 innings across six turns and a traffic rate that a projection punishes the third time through a lineup.
| Team | Runs/game | Batting average | Home or road split |
|---|---|---|---|
| Miami Marlins | 4.58 | .254 | 30-17 home |
| Seattle Mariners | 4.05 | .230 | 20-26 road |
| Detroit Tigers | 4.25 | .236 | 25-21 home |
| Athletics | 4.55 | .247 | 22-23 road |
Context sharpens the projection. Detroit enters on a four-game winning streak and a 7-3 record over its last ten, while the Athletics arrive at 1-9 across their last ten and losers of five straight. A win-probability model built from the starter gap and the recent run-prevention trend lands the Tigers comfortably above the 55.6 percent break-even a -125 favorite requires. The Mariners appear on the board too, but their bat travels poorly at a .230 team average and a 20-26 road record, and Seattle's own quality does not enter this particular output because the play is Detroit's moneyline, not a total.
What Breaks The Projections
Each output has a defined failure mode. The Marlins under leans almost entirely on Bryce Miller, so a 0.66 WHIP regressing toward his career norm on this specific night, or a short outing that hands three innings to a shakier Seattle bullpen, is the path to four Miami runs. A single swing over the loanDepot wall also clears the number by itself. The Tigers output is the thinner of the two by design: Valdez's 1.38 WHIP means his edge is about limiting damage rather than overpowering, and a couple of walks plus one extra-base hit can flip a one-run favorite, especially if Perkins outpitches a 6.75 ERA for five innings. A model edge is a distribution across many simulations, never a guaranteed result on one.
Model Verdict
The July 9 run-prevention model ranks the Miami Marlins team total under 3.5 at -120 first, driven by Bryce Miller's 0.66 WHIP and a park that suppresses scoring, and it ranks the Detroit Tigers moneyline at -125 second, driven by a 2.46-run starter ERA gap over Jack Perkins and a Detroit club trending up while the Athletics crater. For the method applied across earlier slates, work through the July 6 run equation model, the advanced stats hub, the daily MLB breakdown picks, and the full model archive.