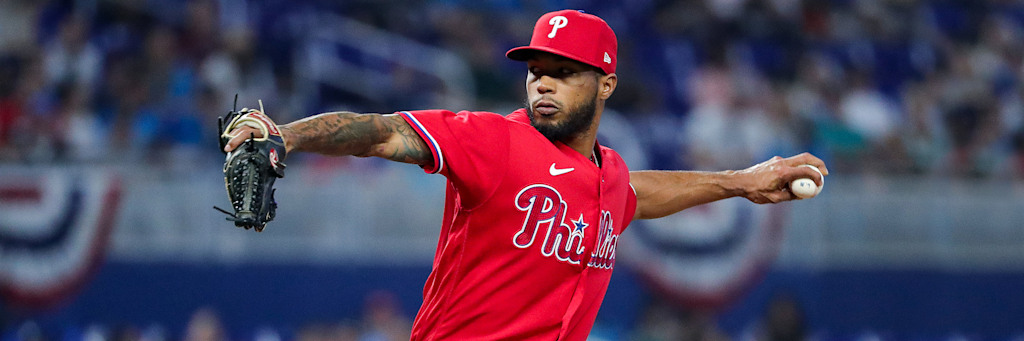
Every full slate produces one starter matchup where the equation is not close, and on July 6 it happens in Kansas City. Cristopher Sanchez carries a 2.00 ERA over 18 starts into Kauffman Stadium, and Noah Cameron answers with a 4.95 ERA of his own, a 2.95-run gap between the two starting inputs on today's board, the widest of any of the twelve pitchers scheduled. When a gap that size sits on a game priced at a number the model can still clear, it becomes the day's top output before a single lineup number is even applied. Everything else on this six-game board is ranked beneath it by the same two-term equation.
The Framework: Traffic Times Conversion
Runs decompose into two measurable terms. The first is traffic, how many runners the opposing starter allows, which ERA and opponents' quality capture directly. The second is conversion, how efficiently a lineup turns its opportunities into runs, which shows up in runs per game at the season scale. Most daily models chase the first term and treat the second as noise. This board punishes that habit, because the conversion spreads are real: the Dodgers turn their at-bats into 5.31 runs a game while the Blue Jays manage 3.96 from a similar volume of outs. Each projection below multiplies the two terms for both sides of a game, compares the resulting distribution to the market number or the market price, and ranks the six outputs by the size of the gap. Runs-per-game figures are sourced from StatMuse's 2026 team splits; team ERA figures are sourced from MLBDB.com's 2026 team pitching leaderboard, which independently confirms the Rockies' 5.54 team ERA as the worst mark in the majors this season.
| Team | Runs/game | Team ERA |
|---|---|---|
| Los Angeles Dodgers | 5.31 | 3.47 |
| Milwaukee Brewers | 5.10 | 3.36 |
| Colorado Rockies | 4.87 | 5.54 |
| New York Yankees | 4.80 | 3.39 |
| Tampa Bay Rays | 4.55 | 3.76 |
| St. Louis Cardinals | 4.63 | 4.14 |
| Philadelphia Phillies | 4.47 | 4.11 |
| Arizona Diamondbacks | 4.24 | 4.30 |
| Kansas City Royals | 4.10 | 4.88 |
| San Francisco Giants | 4.09 | 4.49 |
| Toronto Blue Jays | 3.96 | 4.12 |
| San Diego Padres | 3.91 | 4.24 |
Output 1: Phillies Moneyline (-181)
The projection starts with the widest single-variable gap the model has this week. Sanchez sits at 2.00 ERA across a 10-3 record, a mark built on suppressing traffic all season, and Cameron carries a 4.95 ERA on a 4-6 record for Kansas City. Philadelphia's own conversion term is a solid 4.47 runs a game against a Royals team ERA of 4.88, while Sanchez's own defense-adjusted number, a 4.11 team ERA, gives the Phillies a clean two-way advantage. The break-even at -181 is 64.4 percent. Philadelphia's straight-up rate as a betting favorite this season sits at 63.1 percent, a fraction under that number on its own, which is exactly why the starter gap matters: a 2.95-run ERA differential is far wider than the average favorite scenario baked into that 63.1 percent figure, and it is that added margin, not the season rate alone, that pushes the projection over the number. The supporting data point is blunt: Philadelphia is 8-1 straight-up this season at odds of -196 or shorter, and Kansas City is 20-35 as an underdog.
Output 2: Dodgers Moneyline (-210)
| Item | Model detail |
|---|---|
| Run column | Los Angeles Dodgers offense and bullpen, Dodger Stadium |
| Opposing starter | Kyle Freeland (2-7, 7.25 ERA, 68 K) |
| Own starter | Eric Lauer (4-5, 4.84 ERA, 44 K, acquired from Toronto May 17) |
| Model line | Dodgers moneyline (-210) |
This output is the largest team-quality gap on the board even though it carries the steepest price. Freeland's 7.25 ERA is the single worst starting mark of any of the twelve pitchers scheduled today, and he brings it into a lineup, the Dodgers, that scores 5.31 runs a game, the best conversion rate of any team on this card, backed by a 3.47 team ERA that ranks third-best. Colorado's 37-54 record and MLB-worst 5.54 team ERA sit 22 games behind a Dodgers club at 59-32, one of the best records in the sport. The Rockies' 4.87 runs-per-game figure looks respectable in isolation, but it is inflated by a full slate of Coors Field home dates, and it does not travel to a road environment against a projected Dodgers run column this strong. Ohtani has been day-to-day this week with right biceps tightness, a precautionary absence rather than a confirmed injury, and it is flagged here as a variance input on the offensive side rather than assumed as a lineup change for tonight specifically. The break-even at -210 is 67.7 percent, the highest bar on the board, and the 2.41-run starter gap plus the record and team-ERA gap is what the model needs to clear it.
Output 3: Yankees-Rays Under 7.5 (-116)
Two of the board's best starter inputs land in the same game at Tropicana Field. Cam Schlittler, the 2026 AL All-Star Game starter, carries a cumulative ERA near 2.08 on the season and was as low as 1.71 during one stretch, the lowest ERA by a Yankee through 16 starts since Whitey Ford in 1964. Griffin Jax counters at 3.45 ERA for a Rays team that leads the AL East at 52-35. New York's 4.80 runs-per-game figure is a season-long blend that includes games with Aaron Judge, who has been on the injured list since May 31 with a right first-rib stress fracture and is not expected back before late July at the earliest, more likely mid-August. That means the season average understates how suppressed the current Yankees lineup actually is relative to the total priced tonight. Tampa Bay converts at 4.55 runs a game, middle of the pack among the twelve teams on this board. Two starters both under 3.50 ERA, playing across from a lineup missing its best power bat, is a clean traffic argument for the under at a modest -116, a 53.7 percent break-even.
Output 4: Giants-Blue Jays Under 7.5 (-114)
San Francisco and Toronto are two of the three weakest-scoring offenses on today's board, at 4.09 and 3.96 runs a game respectively, and Kevin Gausman brings a 4.19 ERA into Oracle Park behind them. Landen Roupp is the lesser input here, a 4.55 ERA across 5-8, and he is throwing to a Blue Jays lineup that already ranks near the bottom of this card's conversion table, while Gausman's own number is the stronger of the two, enough to anchor the projection alongside the two weak offenses. Toronto's team ERA of 4.12 and Giants' 4.49 are both middling, which is why this output ranks behind the Yankees-Rays under rather than ahead of it, the traffic input on one side is stronger than the other. At -114, the break-even is 53.3 percent, and two bottom-third offenses paired with one elite starter clears it.
Output 5: Diamondbacks-Padres Under 8.5 (-109)
San Diego's 3.91 runs-per-game figure is the single lowest scoring rate of any team on this board, and Arizona's 4.24 sits in the bottom half as well; the naive sum of the two, 8.15, already sits below the market number with room to spare. The complication is the starters. Walker Buehler is a middling 4.61 ERA for San Diego, and Brandon Pfaadt is the shakiest traffic input in this entire six-game output list at 5.40 ERA for Arizona, a number that argues against the suppression the two lineups otherwise support. The model still ranks this an under, because the total sits a full run and a third above the combined scoring base rate for two offenses that both finished in the bottom four of the runs-per-game table, but it ranks behind every output above it precisely because Pfaadt's traffic term works against the projection rather than for it. At -109, the break-even is 52.2 percent, the cheapest number on the board, matched with the thinnest starter conviction.
Output 6: Brewers-Cardinals Under 8 (-114)
This is the board's most conflicted output. Milwaukee owns the best record in the National League at 55-33 and the second-best conversion rate on this entire card at 5.10 runs a game, a figure that argues directly against any under. Shane Drohan is a legitimate suppression arm at 3.12 ERA, but he is working opposite Dustin May, who carries a shakier 4.80 ERA for St. Louis, a Cardinals team that converts at a middle-of-the-pack 4.63 runs a game. Two of the board's four inputs point toward the under, Drohan's ERA and the Cardinals' merely average bat, and two point away from it, May's shaky number and Milwaukee's potent offense. A model that is honest about conflicting signals ranks this output last: the projection still leans under at -114, a 53.3 percent break-even, but it is the thinnest edge of the six, propped up mostly by Drohan rather than by any lineup-side agreement.
| Rank | Output | Line | Break-even | Primary driver |
|---|---|---|---|---|
| 1 | Phillies moneyline | -181 | 64.4% | 2.95-run Sanchez-Cameron ERA gap, widest on the board |
| 2 | Dodgers moneyline | -210 | 67.7% | MLB's worst rotation ERA (7.25) opposing a 5.31-run offense |
| 3 | Yankees/Rays under | 7.5 (-116) | 53.7% | Two sub-3.50 ERA starters, Judge-less Yankees lineup |
| 4 | Giants/Blue Jays under | 7.5 (-114) | 53.3% | Two bottom-third offenses, Gausman's 4.19 ERA |
| 5 | Diamondbacks/Padres under | 8.5 (-109) | 52.2% | Padres' 3.91-run offense, capped by Pfaadt's 5.40 ERA |
| 6 | Brewers/Cardinals under | 8 (-114) | 53.3% | Drohan's 3.12 ERA fighting Milwaukee's own 5.10-run bat |
What Breaks The Projections
Each output fails a specific way. The Phillies moneyline loses if Cameron's shaky ERA is a small-sample artifact rather than a true talent level, since a 4-6 record over a partial season carries real variance. The Dodgers output is priced at the richest break-even on the board, and any bullpen letdown behind Lauer, or an unexpectedly effective Freeland start, closes the gap fast; Ohtani's day-to-day biceps status is a watch item that could shave a run off the Los Angeles side if he sits. The Yankees-Rays under breaks if either bullpen implodes late, since both starters are projected for six-plus innings, not nine. The Giants-Blue Jays under leans on Gausman carrying most of the projection alone. The Diamondbacks-Padres under is the most exposed output, because Pfaadt's 5.40 ERA is a real, not a theoretical, risk to the total. The Brewers-Cardinals under is the thinnest edge on the board by design, and it loses outright if Milwaukee's 5.10-run offense has a normal night against a shaky May. Probable starters were not confirmed at publication beyond the pitchers listed; a model edge is a distribution, never a result.
Final Verdict
The July 6 run equation model puts the Phillies moneyline first, driven by the widest starter ERA gap on the entire board, 2.95 runs between Sanchez and Cameron, layered on top of a season-long trend that already has Philadelphia winning 63.1 percent of its games as a favorite. The Dodgers moneyline follows as the largest team-quality gap of the day, MLB's worst rotation arm walking into the game's best offense-and-defense combination. The Yankees-Rays under, the Giants-Blue Jays under, the Diamondbacks-Padres under and the Brewers-Cardinals under round out the board in descending order of projected margin, the last of them propped up by a single starter rather than any two-sided agreement. For the method applied to prior boards, see the July 5 run equation model, the advanced stats hub, the daily MLB breakdown picks, and the MLB futures board.