A run-environment model spends most of a Friday like this one measuring baserunners. Every projected total, team total and first-inning number traces back to how often each starter lets a man reach, because runs are the product of traffic and the sequence that follows it. The July 3 board is unusually clean on that axis: the lowest WHIP on the slate belongs to a Dodgers starter carrying it into a game the market has set at eight, and the model reads that as its strongest suppression input of the night. Around it sit a team total driven by another sub-1.20 WHIP arm, a win probability in the one game where the better team is priced flat, a strikeout-fueled under, and a single output where the park overwhelms both starters. Each is ranked below by the gap between the model line and the market, adjusted for the variance the bet shape carries.
The Framework: Runs Are Traffic Times Sequence
Before the outputs, the method. The model builds a projected run distribution for each lineup from the opposing starter's baserunner rate, strikeout rate and the park's run environment, then reads every market off that distribution. A game total under asks whether the sum of two distributions falls short of the posted number. A team total isolates one distribution and asks where its median sits. A win probability compares the two distributions head to head. A first-inning no-run output narrows the projection to the opening frame's run expectancy. WHIP is the single most useful starting input because it measures traffic directly, and strikeout rate refines it by capping the sequence, since a runner who reaches with two outs and a whiff coming scores far less often than one who reaches with contact behind him. The ranking that follows tracks how far each projection sits from the market, not preference.
Padres-Dodgers Under 8: The Lowest WHIP On The Board
| Item | Model detail |
|---|---|
| Run environment | Full game, Dodger Stadium |
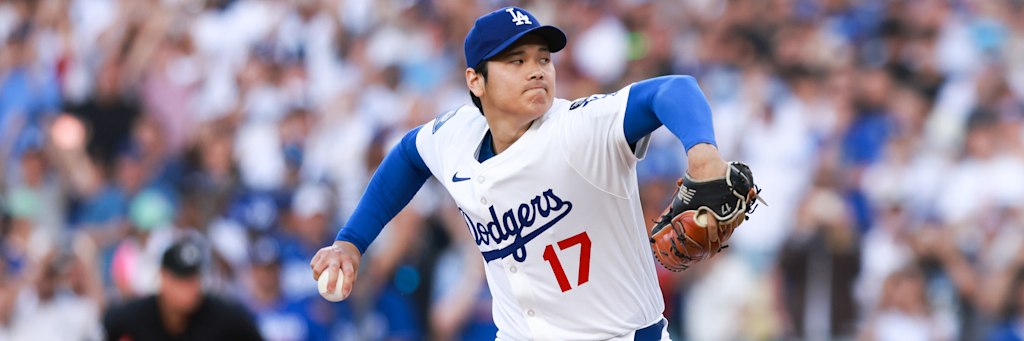
| Starters | Shohei Ohtani (8-2, 1.58 ERA, 0.90 WHIP, 86 K in 79.2 IP) vs Michael King (5-7, 3.55 ERA, 83 K in 96.1 IP) |
| Records | Dodgers 57-31, Padres 43-43 |
| Model line | Game total under 8 (-113) |
This is the top output because both distributions compress at once. Shohei Ohtani carries a 0.90 WHIP, the lowest baserunner rate of any starter on the slate, which means the Padres distribution shifts hard toward its low end before sequence even enters the calculation. His 1.58 ERA over 79.2 innings confirms that the traffic he does allow rarely scores. On the other side Michael King is no soft counterweight at a 3.55 ERA with 83 strikeouts in 96.1 innings, so the Dodgers distribution is also held below its ceiling. When both starters suppress traffic and the posted number is eight, the projected sum clusters below it, and the under at -113 ranks first on the widest margin between model and market on the board.
One honest counterweight is the shape of the Dodgers offense. Los Angeles owns one of the deepest lineups in the sport at 57-31, so the left tail of this projection, a single crooked inning that pushes the game over on its own, is live even against a good King start. The margin is favorable, but the total is a sum of two lineups, and one of them can carry it alone, which is why the under leads on edge rather than being treated as a lock.
Astros Team Total Under 4.5: A Second Sub-1.20 WHIP Input
| Item | Model detail |
|---|---|
| Run column | Houston Astros offense, at Daikin Park |
| Opposing starter | Nick Martinez (7-2, 2.66 ERA, 1.15 WHIP in 94.2 IP) |
| Records | Astros 43-46, Rays 51-33 |
| Model line | Team total under 4.5 (-140) |
That second output isolates a single distribution, which is what makes a team total a cleaner projection than a full game total. Nick Martinez carries a 1.15 WHIP across 94.2 innings, the second-lowest baserunner rate on the slate, and a 2.66 ERA that says the traffic he allows is not converting. The model only has to answer one question here: where does the Houston run column's median sit against that profile. A 43-46 offense facing a sub-1.20 WHIP arm projects a median comfortably below five, so the under 4.5 captures it without any exposure to how Tampa Bay scores. It ranks second rather than first only because the -140 price is steeper, lifting the break-even to roughly 58 percent and narrowing the room between projection and payout.
Rays Win Probability: The Better Distribution At A Flat Price
| Output | Line | Primary input |
|---|---|---|
| Rays moneyline | -110 | Head-to-head distribution edge priced as a coin flip |
The third output is the board's clearest case of a distribution edge the market has priced flat. Tampa Bay at 51-33 owns the stronger run distribution and sends the better starter, Nick Martinez and his 2.66 ERA, against Houston's Spencer Arrighetti, a 7-4 arm with a 4.00 ERA and a 1.29 WHIP in 72 innings. When the model runs the two distributions head to head, the Rays clear the win-probability threshold by a comfortable margin, yet the market prices the game at -110, a coin flip. That gap between a genuine edge and a flat price is why this ranks third despite being a moneyline, the bet shape the model normally discounts. It sits behind the two unders only because a single-game win probability carries more variance than a suppressed total, not because the edge is smaller.
Padres-Dodgers NRFI: The First-Inning Sub-Distribution
A fourth output narrows the marquee game to its opening frame. A no-run-first-inning projection reads only the first-inning run expectancy of the two starters, and Ohtani's 0.90 WHIP is the ideal input, because a pitcher who rarely allows a baserunner almost never allows the sequence that produces a first-inning run. Michael King's 3.55 ERA holds up the San Diego half of the frame well enough to keep the joint probability of a scoreless first high. The model outputs the NRFI at -114 as a clean first-inning read, but it ranks below the full-game plays because a single-inning bet is a binary that one early swing flips, which caps how heavily the projection can be trusted regardless of its width.
Blue Jays-Mariners Under 7: The Strikeout Lever
| Item | Model detail |
|---|---|
| Run environment | Full game, T-Mobile Park (suppressing venue) |
| Starters | Dylan Cease (4-4, 3.02 ERA, 128 K in 83.1 IP) vs Luis Castillo (3-6, 4.93 ERA, 1.36 WHIP) |
| Records | Blue Jays 41-46, Mariners 45-43 |
| Model line | Game total under 7 (-105) |
This fifth output is the model's purest strikeout play. Dylan Cease has 128 strikeouts in 83.1 innings, a rate near fourteen per nine that is the highest on the slate, and strikeout rate is the lever that caps sequence: even when Cease allows traffic, the whiff removes the runner-advancing contact that turns baserunners into runs. Layer that on T-Mobile Park, one of the most run-suppressing environments in the league, and the Toronto-side distribution compresses sharply. The catch is the other half. Luis Castillo carries a 4.93 ERA and a 1.36 WHIP, the leakiest starter in this game, so the Seattle distribution has a fatter right tail than the low total wants. The model still outputs the under 7, but it ranks fifth because one starter suppresses and the other does not, which widens the joint projection and is why the market left the price near even at -105.
Marlins Moneyline And Over 10.5: The Park Output
That final game produces two outputs that appear to conflict and do not. The Athletics are hosting at Sutter Health Park in Sacramento, a small, hot venue that ranks among the friendliest run environments in the sport, and they start Jack Perkins at a 6.00 ERA over 51 innings, the highest ERA on the board. Miami counters with Tyler Phillips at a 3.02 ERA. The model outputs the Marlins moneyline at +118 because the starter-quality gap, three full runs of ERA, shifts the win probability toward Miami even on the road, and it outputs the game over 10.5 because the park and Perkins inflate the joint distribution regardless of who wins. A team can be the favorite to win while the total is projected high, since one is a comparison of distributions and the other is their sum. Both are high-variance outputs, the moneyline because a single game is binary and the over because a bandbox total swings on bullpen usage, which is why they sit at the bottom of the ranking despite real projected edges.
The Full Model Card, Ranked
| Rank | Output | Line | Why it ranks here |
|---|---|---|---|
| 1 | Padres/Dodgers under | 8 (-113) | Ohtani 0.90 WHIP, both distributions compress |
| 2 | Astros team total under | 4.5 (-140) | Martinez 1.15 WHIP, clean single column, steeper juice |
| 3 | Rays win probability | -110 | Better distribution priced as a coin flip |
| 4 | Padres/Dodgers NRFI | -114 | Ohtani first-inning expectancy, binary tail |
| 5 | Blue Jays/Mariners under | 7 (-105) | Highest strikeout rate vs a leaky Castillo half |
| 6 | Marlins moneyline | +118 | Three-run ERA gap, single-game variance |
| 7 | Marlins/Athletics over | 10.5 (-115) | Sacramento park output, bullpen-dependent tail |
That order tracks the width of each projection rather than the appeal of the headline. The two unders lead because their distributions compress on the lowest WHIP inputs on the board, the Padres-Dodgers total ahead of the Astros column on the friendlier price. The Rays win probability follows as a distribution edge the market flattened, the NRFI and the Blue Jays-Mariners under sit in the middle as a binary and a split projection, and the two Sacramento outputs close as the highest-variance reads on the slate. Sizing should follow the spread of each projection, heaviest where the distribution clusters tightest and lightest where a single inning or a bullpen decides it.
What Beats This Card
A single crooked inning beats a run-prevention board. The Padres-Dodgers under loses if the deep Dodgers lineup pushes the game over on one big frame even against a strong Ohtani start. The Astros team total busts on a single three-run inning against Martinez. The Rays win probability is still a single game, so Arrighetti can out-pitch his ERA and hold Houston's edge at home. The NRFI dies on one first-inning swing, and the Blue Jays-Mariners under falls if Castillo's 4.93 ERA turns into a Toronto rally. The Marlins moneyline needs a road favorite to hold, and the over 10.5 depends on the bandbox and the bullpens cooperating. Lineups were not all confirmed at publication, so the projections assume listed regulars and probable starters. The model is favored on its outputs, but favored is a probability, not a result.
Final Verdict
The July 3, 2026 model breakdown outputs the Padres-Dodgers under 8 as its anchor, the tightest projection on the board behind Shohei Ohtani and a 0.90 WHIP. The Astros team total under 4.5 follows on Nick Martinez and a 1.15 WHIP, and the Rays win probability at -110 is a distribution edge the market priced flat. The Padres-Dodgers NRFI at -114 narrows the marquee game to its first inning, the Blue Jays-Mariners under 7 rides the highest strikeout rate on the board, and the Marlins moneyline at +118 with the game over 10.5 are the high-variance park outputs from Sacramento. The through-line is that runs are traffic times sequence, and the board's lowest WHIP arms sit on the model's strongest plays. For more model work, see the July 2 run-prevention model, the advanced stats hub, the daily MLB breakdown picks, and the MLB futures board.